“Davidson” submits:
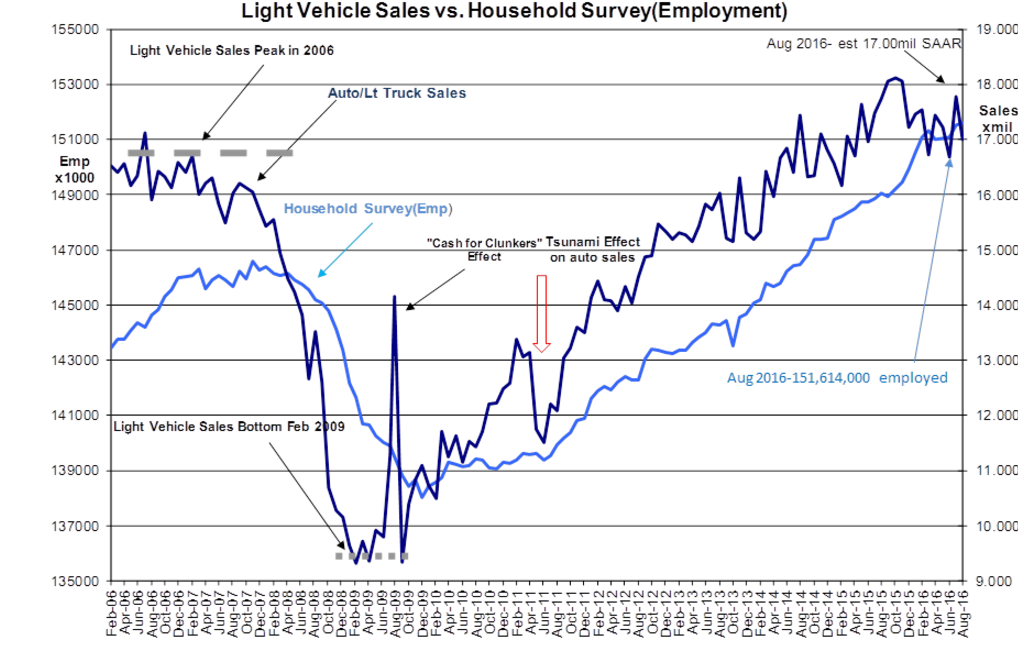
Employment and Vehicle Sales reported this week remain on long-term trends. The ‘on-again’/’off-again’ discussions leading into these reports and even the vigorous discussion about the details as to what it all means shows that predicting single-month reports remains a muddle. Economic data is gathered at a point in time. This relies on individuals reporting data to government agencies which being part of our ‘Human System’ may not be immediately available. To meet reporting dates, agencies statistically analyze the data received and report a number which is nearly always revised in later reports as reports drift in. Sometimes adjustments to previously reported figures can include 3-4 previous reports. Trying to parse a single-month’s report when history shows it is rarely the final official figure has never made sense to me, but it does seem to make for good media discussion.
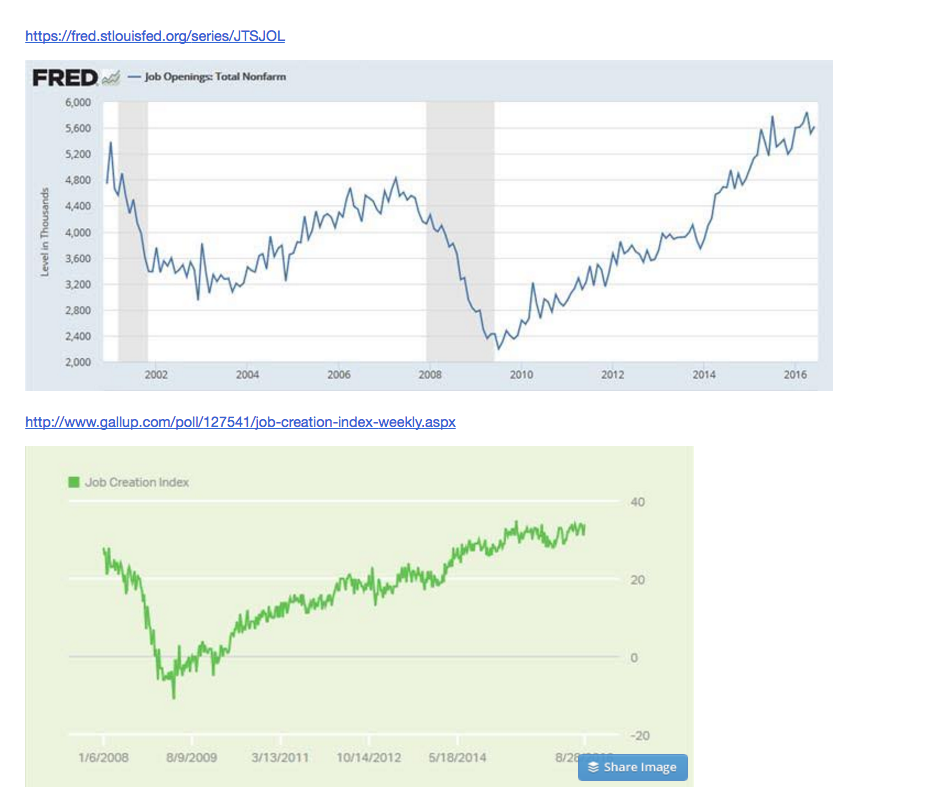
What matters most in economic data are its trends and the correlations with other measures. Retail spending and employment are strong indicators of the direction of future trends. Two useful employment indicators are the Bureau of Labor Job Openings report and the Gallup Job Creation Index. Both of these are in trends which forecast a high likelihood of a rise in employment levels in future months. Higher employment bodes well for future economic expansion and higher equity prices.
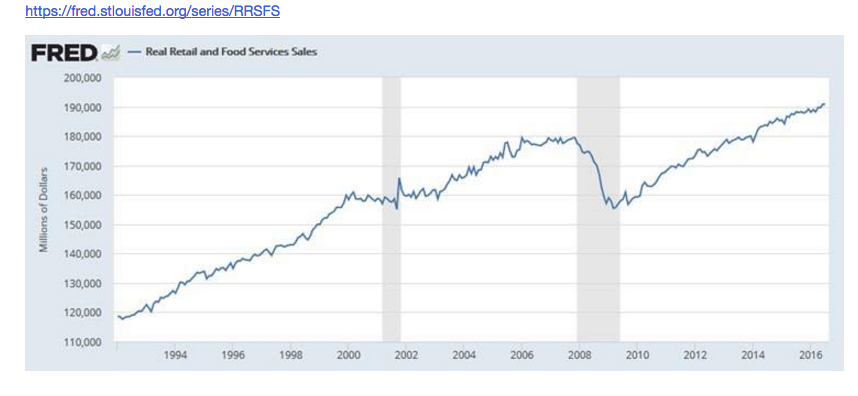
Another useful indicator is Real Retail and Food Service Sales which includes the US$ value of Light Weight Vehicle Sales. This indicator continue on trend. Historically this indicator tends to flatten prior to economic corrections. The current trend forecasts continued economic expansion which bodes well for future economic expansion and higher equity prices.
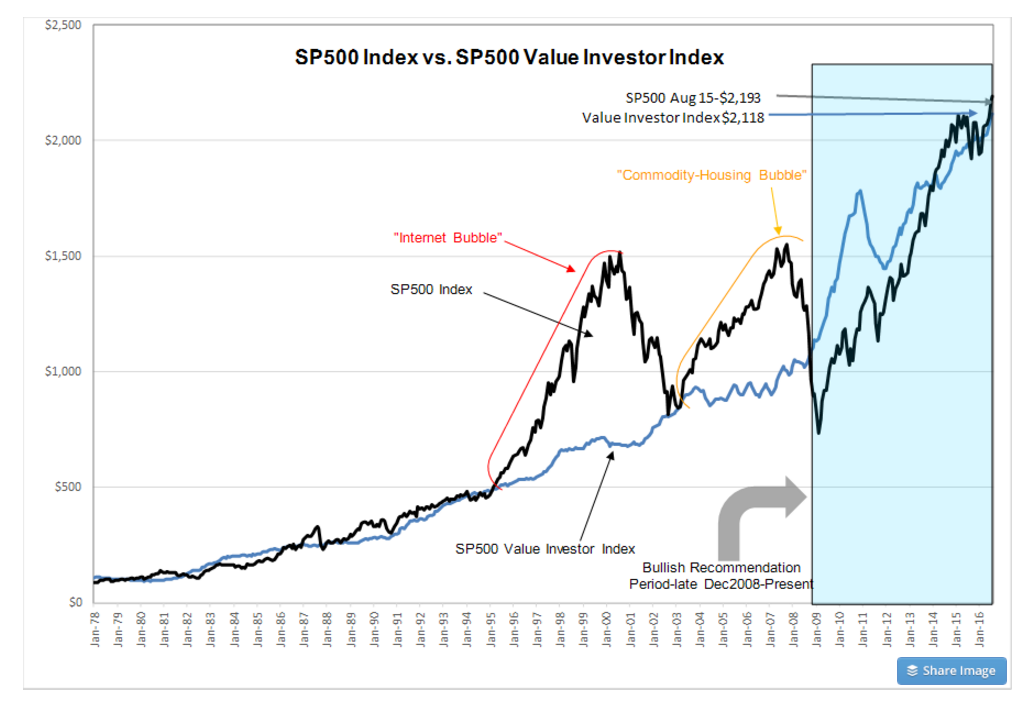
Interestingly, recent revision in the Dallas Fed’s Trimmed Mean PCE inflation measure has seen a drop in inflation from 1.8% 4mos ago to 1.6% in the most recent report. This measure is used as part of the capitalization rate used to calculate the SP500 Value Investor Index. The Value Investor Index is a measure of the level of the SP500 ($SPY) which attracts the buying of Value Investors. The SP500 Value Investor Index sits at $2,118 with the SP500 this morning priced ~$2,180. We are at an attractive level for Value Investors currently. Past periods of market speculation resulted in the SP500 at 55%-100% higher than the SP500 Value Investor Index. Market speculation by this measure is relatively low. This does not mean investors could not suddenly panic and sell the market down from current levels. Prices are driven by trends in market psychology and a surge in pessimism can occur at any point in time. Should consensus market pessimism suddenly surge and lower prices, at current levels we can expect Value Investors to step-up their buying to take advantage of bargains.
Value Investors pay attention to the same trends in retail sales and employment as shown here. Large Cap stocks are currently priced at attractive levels within the context of continued economic expansion. In spite of missteps by Central Bankers at home and abroad, global economic growth continues. Free Market activity has a good history of correcting the market-skewing efforts of misguided even though well-meaning Central Banker attempts at economic control. In my opinion, there is plenty economic fuel available if Central Banker simply step aside to drive global growth and markets to substantially higher levels the next several years. Key indicators that we are headed in this direction will be a much weaker US$ (30% weaker as it returns to its long term trend) and much higher 10yr Treasury yields (Wicksell’s ‘Natural Rate’ indicates 10yr Treasuries yield should be closer to 5%).