
August 5, 2016
By Steve Blumenthal
“There is no panacea for the low returns implied by asset valuations today. Anyone suggesting differently is either fooling themselves or trying to fool you. But piling into the assets that have been the biggest help to portfolios over the past several years, as tempting as it may be, is probably an even worse idea than it usually is.”
– Ben Inker, GMO
Today, let’s take a look at the most recent market valuations and what they are telling us about forward returns over the next ten years. But keep in the back of your mind that you can get pretty close on seven and ten-year return probabilities but it is a coin flip on what the equity returns will be over next number of months.
We do know that the insatiable demand for stocks with above average yield is causing valuations to diverge materially from historical norms. This may continue. In a recent State Street poll, investors were asked what their returns expectations are for the next five years and beyond for real estate, commodities, equities and bonds.
Answer: 10.9% for real estate, 8.1% for commodities, 10% for equities and 5.5% for bonds

10% for equities? I find myself wondering who spiked their punch bowl.
I previously wrote that in December 1999, GMO’s seven-year forward return forecast predicted a negative annualized real (after inflation) return for stocks. They took a lot of heat but they were proven right.
In the intro quote above, Ben noted, “There is no panacea for the low returns implied by asset valuations today. Anyone suggesting differently is either fooling themselves or trying to fool you.” Amen brother.
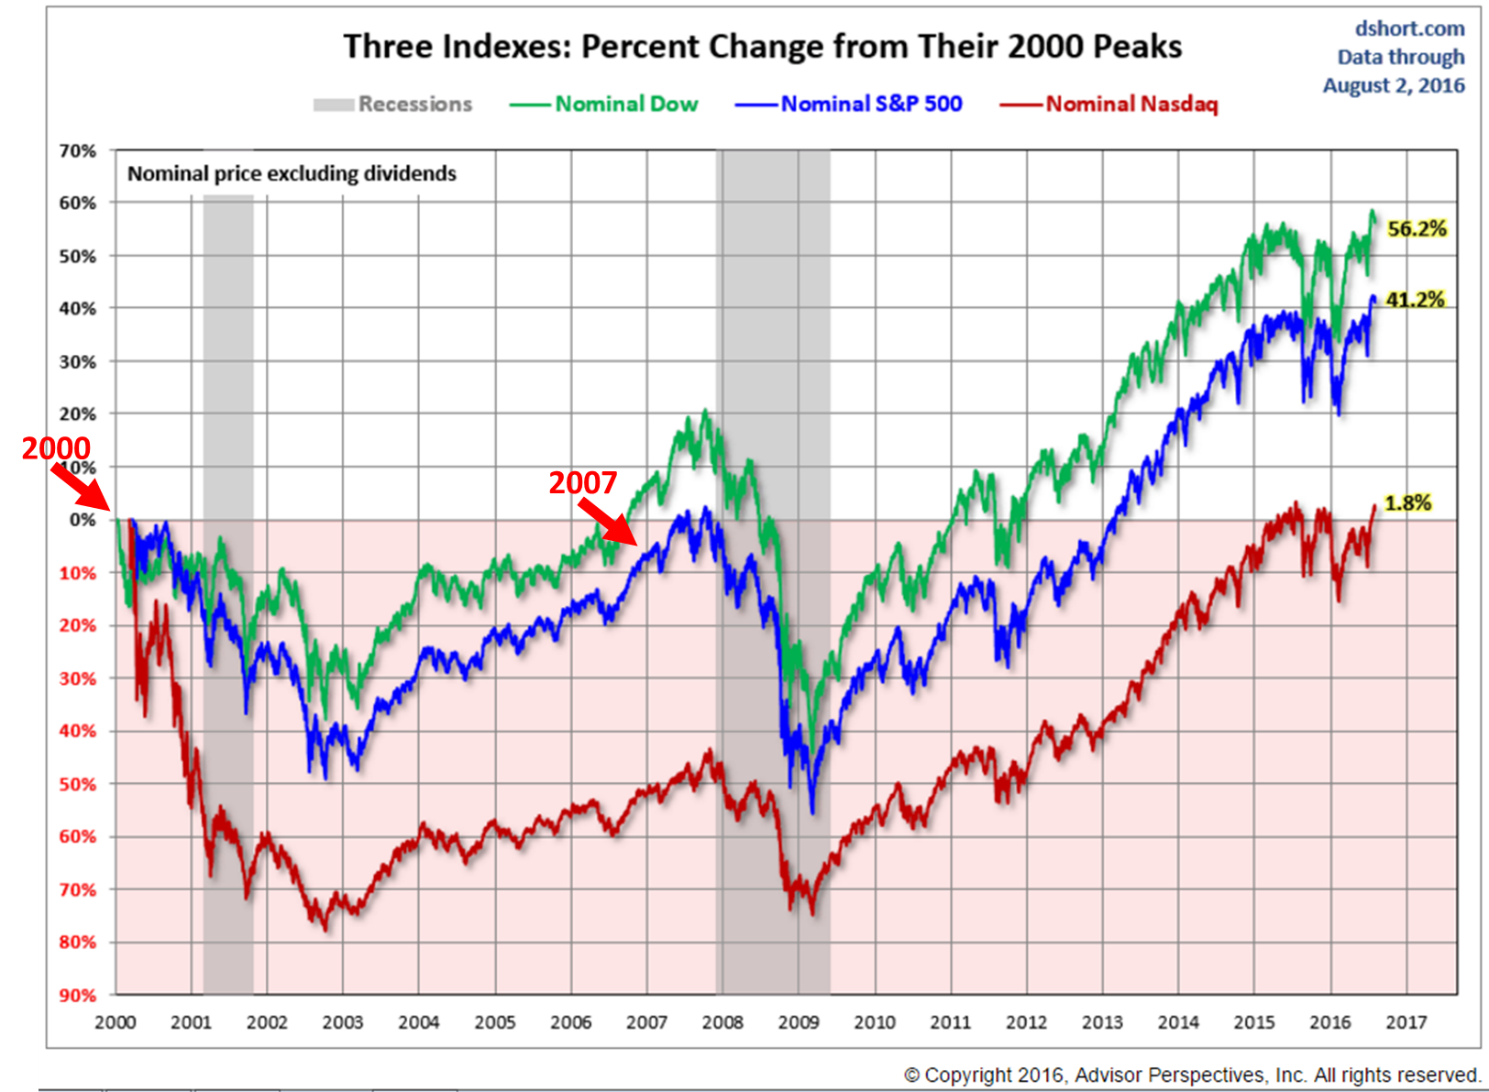
Let’s go back a few years to another point in time when valuations were stretched and investors were “fooling themselves.” Note the two red arrows in the next chart.
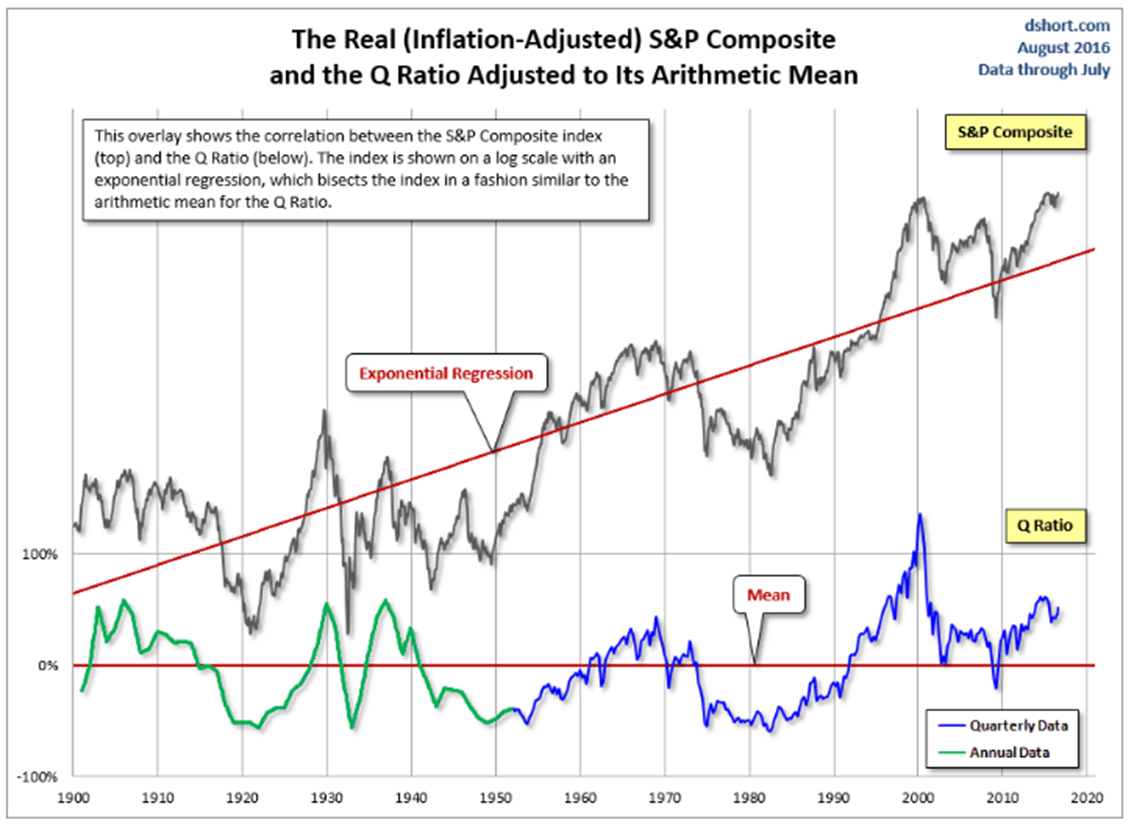
Here is that same chart after inflation is calculated in.
Source: DShort Advisors Perspectives
We find ourselves at a position much like the late 1990s. After a 17-year bull market, valuations were simply too high. Everyone was racing into technology. The market may go higher but what are the implications over the next five, ten and fifteen years — both before and after inflation. And boy, does the Fed wish to create inflation.
As of June 30, 2016, GMO’s seven-year real (after inflation) return forecast for equities is even more negative than it was in 1999. Imagine a negative compounded -2.7% per year over the coming seven years.

Let’s go back to that State Street survey: 10% for equities? 5.5% for bonds?
$100,000 compounded at 10% per year for ten years equals approximately $259,000. That is almost 2.6 times on your money. GMO uses a seven year forecast but I also like ten-year forward return forecasts so let’s consider several investment choices (bets) over the coming ten years.
Maybe you’re not in the 10% return camp? Maybe you are not as bearish as GMO but believe 10% is unlikely. Let’s call it the “hope so” camp so for simplicity’s sake, let’s halve the potential return to 5%. That means that by the end of June 2026, you look back and find that your $100,000 grew to $163,000 or 1.63 times your initial investment.
Finally, let’s consider the GMO outcome. While their return prediction is for a -2.70% after inflation (the actual market return less inflation), let’s assume that inflation is 2.70% and thus makes the nominal (before inflation is subtracted out) return 0%.
Overall, inflation is important because your money has to grow in a way that covers the rising costs of things you need. If inflation is 2% per year, you need a return of 2% on your investments just to keep pace. But I digress.
Three bets to consider: 10%, 5% or 0%.
- #1 State Street Poll (pays you 2.6 to 1) – your $100,000 grows to $260,000
- #2 Hope So (pays 1.63 to 1) – your $100,000 grows to $163,000
- #3 GMO (pays 1 to 1) – your $100,000 grows to $100,000
But before you place your bet, think of GMO as “the house” in the casino. By this I mean they’ve done a great job at calculating the odds of winning. They’ve been posting their forecast metrics out for many years and their accuracy rate is impressive at a high 0.93 (1.0 is a perfect correlation while -1.0 is a perfect non-correlation). No guarantee, of course. Just saying that in the geek world in which I live, 0.93 is really good. Put that calculation in the back of your mind as you place your chips on the table.
Hold on just one additional second. Added in is one last option for you to consider. My thinking is that sometime within the next several years, like times in the past, a correction will take place that will reset the opportunity deck and make forward equity returns good again. Think about the opportunity you had to buy equities in the summer of 2002 or late 2008. So add into the mix option #4:
- #4 GMO/Patience/Defense/Opportunity (pays 1 to 1 over two years then 2 to 1 over the remaining eight years: for overall odds of 2.14 to 1) – your $100,000 grows to $214,000 *(I took 0% over the next two years and then 10% for the remaining eight)
Ok – Step to the table and place your bet. My heart and wallet is hoping for #1 but to me the odds favor #4. That’s my bet. And I hope that my portfolio arrives at the opportunity with principal preserved. That’s the goal. A recession or rising interest rates or both will most certainly hit the popular 60-40 portfolio mix hard. No guarantees.
Early each month, I like to run through the latest valuation measures. Let’s do that today. We’ll take a look at various measures, including my favorite “Median PE”. We’ll also look to see what valuations might be telling us about 10-year forward return probabilities.
If you didn’t take note, go back and look at the chart above that shows the performance of the DJIA, S&P 500 and NASDAQ since 2000. The Dow performed best but take that 56.2% and divide it by 16.5 years. That equates to a compounded annualized return of approximately 3% (before inflation is calculated in). Also, take a look at that 1.8% gain in the NASDAQ. Recall that most of the money was flooding into technology stocks in the late 90s. 1.8% divided by 16.5 years is not so good and that is before inflation is considered.
If you are a CMG client, please note that we may be positioned in high yield bonds, government bonds, equities or seek the safety of treasury bills depending on an investment factor called “momentum.” For example, if you are invested in our CMG Opportunistic All Asset Strategy, you’ll note that we’ve seen technology ETFs showing strong relative price strength. I’m very bearish on high yield over the next several years yet our high yield trend following process has us invested in high yield funds today. Tactical strategies are based on price and trend activity. They do not consider whether the market is over or undervalued.
Because of the flexible nature, the ability to get defensive and the low buy-and-hold equity market return potential, I favor an overweight to tactical and other liquid alternative strategies. They can help balance the risks for upside potential with downside protection.
Grab that coffee and let’s take a quick look at the latest stock market valuations and what the numbers tell us about forward return probabilities.
? If you are not signed up to receive my weekly On My Radar e-newsletter, you can subscribe here. ?
Included in this week’s On My Radar:
- The Q Ratio
- Median PE
- Taking The “E” Train South
- Trade Signals – Bond Market Risks, Zweig Bond Model a Buy, HY Weakening, Sentiment at Bullish Extreme, Gold Trend Positive, CMG Opportunistic All Asset Strategy 45% Equities/55% Fixed Income
The Q Ratio
The Q Ratio is a popular method of estimating the fair value of the stock market developed by Nobel Laureate James Tobin. The Q Ratio is the total price of the market value divided by the replacement cost of all its companies.
Note in the next few charts the current valuation measures (far right) vs. historical numbers. The quick conclusion is the market is expensively priced.
Next are three popular valuation measures. Shiller PE, Crestmont PE and the Q Ratio. Yellow circle is where we are today.
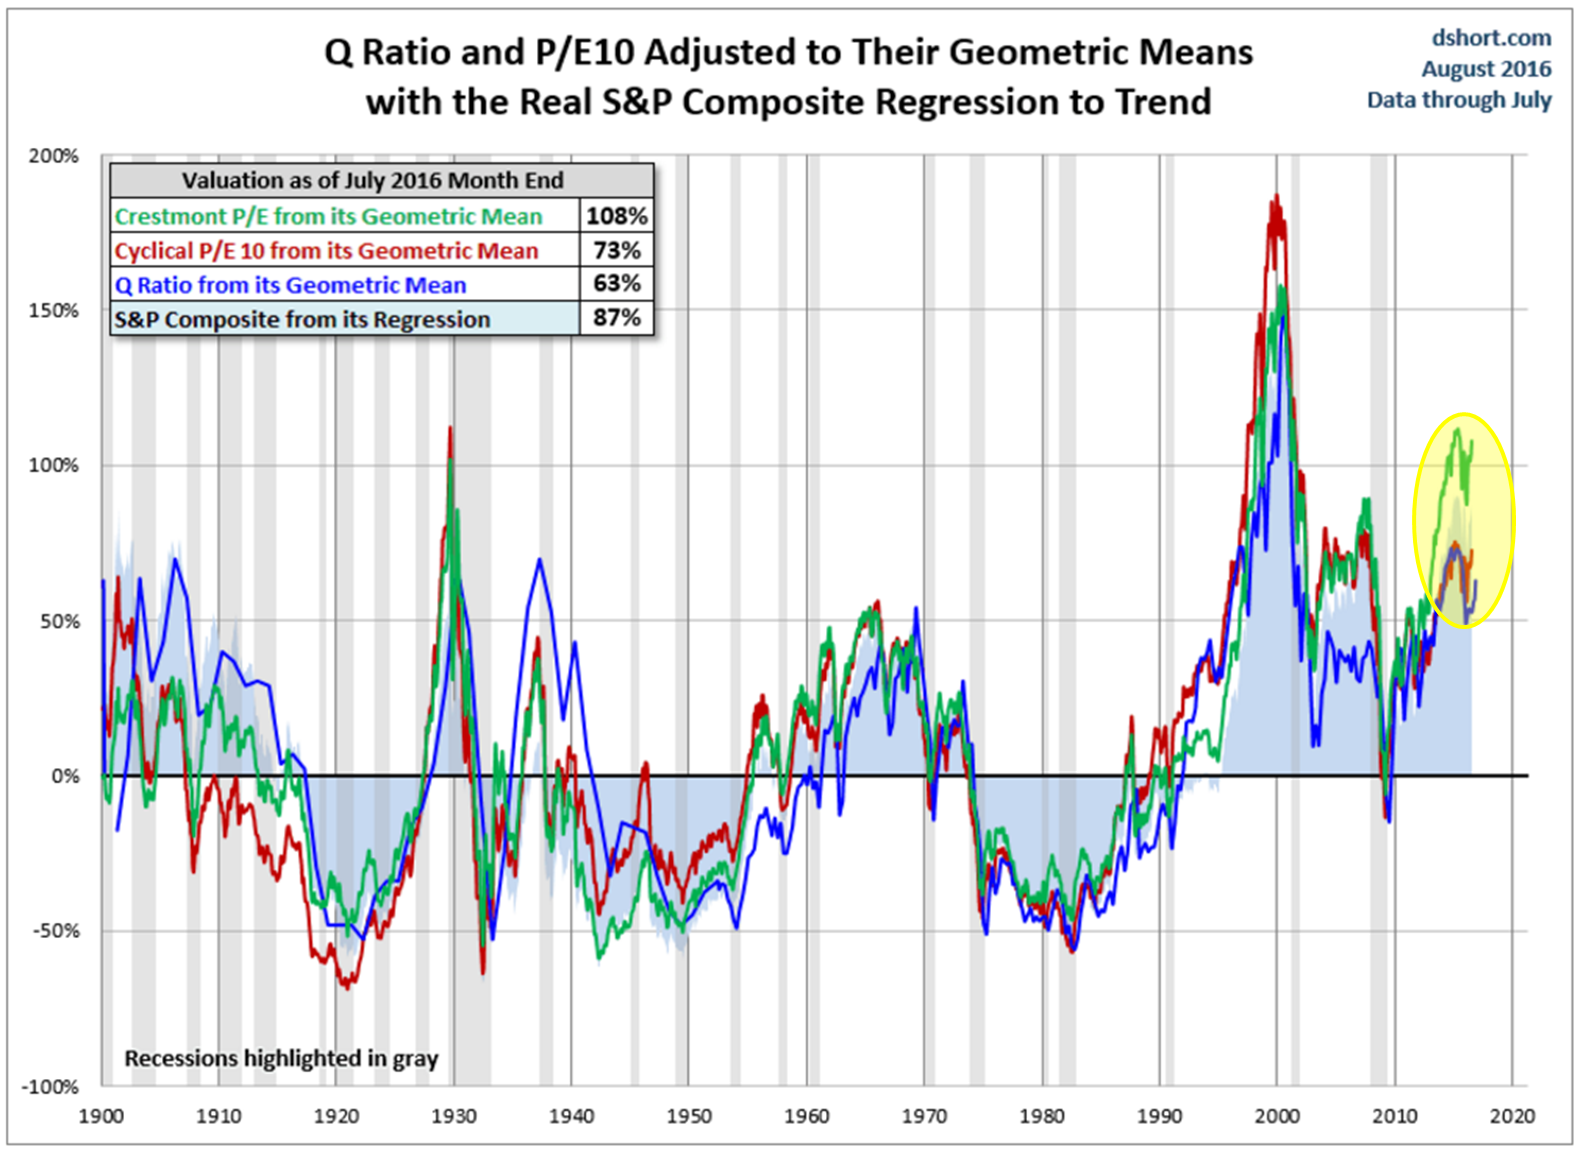
What this means in plain English: Markets move between overvaluation and undervaluation over time. When it gets too far from the norm, it tends to correct. Best to be an aggressive buyer when the ratio is below the red line in the next chart — cautious and hedged when above.
Is the stock market cheap? No. Click here.
Click here to learn more – source.
Here is the Buffett Valuation Indicator
Median PE – Overvalued!
I was surprised to see the number so high (red arrows).
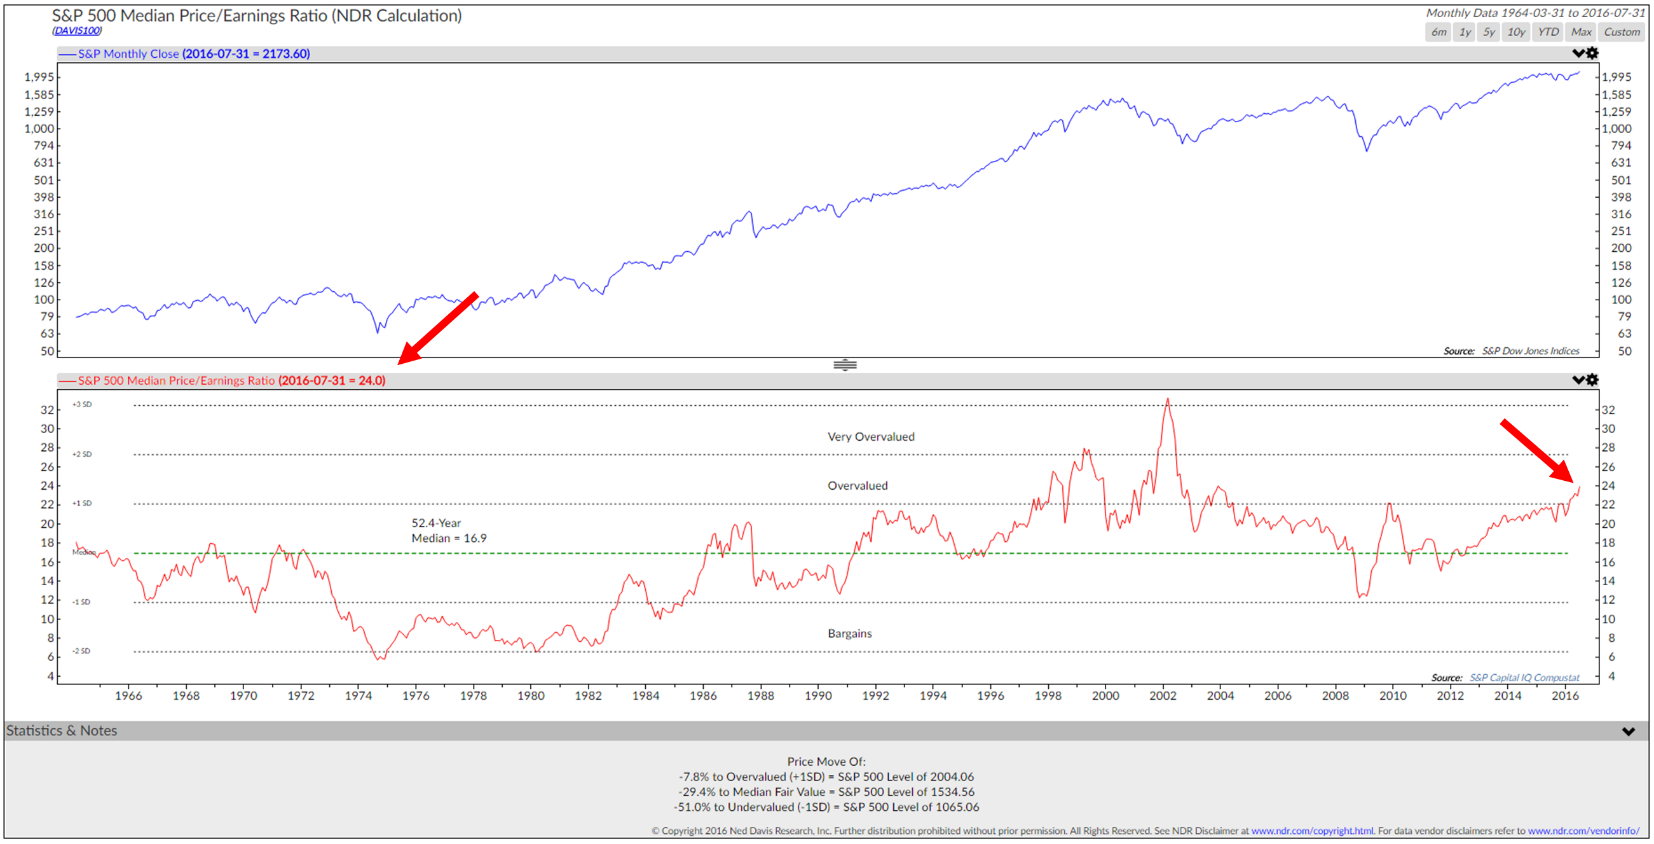
Source: NDR
What this means in regards to forward potential returns? A median PE of 24 puts the valuation level well into the overvalued zone. It puts the market in the most expensive 20% of monthly readings dating back to the 1950s. Past history advises us to expect annualized returns in the 2% to 4% range, before inflation, over the coming ten years and a very bumpy ride along the path to those low returns. A better entry point remains ahead.
Taking the “E” Train South
The “P” in the PE ratio stands for price. When the PE is high, it means the price is high relative to what stocks are currently earning. Over time, we want the companies we invest in to grow their earnings. Price should follow, but when P is high and the “E” (earnings) component is heading south, we need to be careful. It is important to note that PE is a very poor timing tool, yet is a very good forward return forecasting tool. Meaning it tells us little about returns over the short-term but much about returns over the longer-term.
What concerns me today is that the “E” train has been heading south. Six quarters in a row of a decline in S&P 500 index earnings. You may be hearing a lot about the current “earnings recession.” The following chart shows us what it looks like since 2012. Pay particular attention to the earnings decline over the last six quarters:
| ACTUAL | ||
| 03/31/2016 | 2059.74 | $86.44 |
| 12/31/2015 | 2043.94 | $86.53 |
| 09/30/2015 | 1920.03 | $90.66 |
| 06/30/2015 | 2063.11 | $94.91 |
| 03/31/2015 | 2067.89 | $99.25 |
| 12/31/2014 | 2058.90 | $102.31 |
| 09/30/2014 | 1972.29 | $105.96 |
| 06/30/2014 | 1960.23 | $103.12 |
| 03/31/2014 | 1872.34 | $100.85 |
| 12/31/2013 | 1848.36 | $100.20 |
| 09/30/2013 | 1681.55 | $94.37 |
| 06/30/2013 | 1606.28 | $90.95 |
| 03/31/2013 | 1569.19 | $87.70 |
| 12/31/2012 | 1426.19 | $86.51 |
History tells us that past earnings declines have proceeded recession. In this way, the stock market is a leading economic indicator. That doesn’t mean the market can’t move higher. For now, the chase for yield remains in theme, yet we must not blink. It is unusual to see six quarters in a row of decline.
Concluding Thoughts
“In an experiment that will ultimately have disastrous consequences, the Federal Reserve’s policy of quantitative easing intentionally encouraged yield-seeking speculation in this cycle far beyond the point where these warning signals emerged.” John Hussman
I’m reminded of the reckless behavior of Greenspan prior to the 2007 financial crisis and his there is no real estate bubble, no irrational exuberance comments. In the Fed we place great trust. We should be careful! They have enabled an environment of extreme speculation.
Zero interest rate policy has caused investors to race into stocks with above average dividend yields and other high risk assets like junk bonds. They are seeking the perceived safety of dividends and reduced price volatility. I believe they will get just the opposite.
We will look back and identify this market as one of the most reckless financial bubbles of all time. We will look back and identify the next correction as one of the greatest buying opportunities of all time.
Investors are expecting their advisors to deliver 10% returns. There will be disappointment. A lot of money is going to be in motion. I favor a broad-based, holistic asset diversification. Include strategies that may gain in both bull and bear markets. Own some gold. Risk protect that equity exposure and stay tactical with your high yield bond exposure. Robo-like 60/40 is in trouble.
Trend Following Works! Learn more about trend following here. Ahead, I see it as a great opportunity for you and your business.
The “E” train will turn back north. It is best to hop on when prices are attractive. Until then, stay tactical and mindful of risk.
As a quick aside: I share a number of views on the markets and the global economy each week in On My Radar. If you are a CMG client, you may find that our current allocations may be invested in ETFs that may seem contrary to our macro view. For that reason, I wrote a piece called, “What On My Radar Means as it Relates to Our Investment Strategies and Your Clients’ Portfolios.” I hope you find it helpful.
Trade Signals – Bond Market Risks, Zweig Bond Model a Buy, HY Weakening, Sentiment at Bullish Extreme, Gold Trend Positive, CMG Opportunistic All Asset Strategy 45% Equities/55% Fixed Income
Click through to find the most recent Trade Signals. My favorite weight of evidence indicator, the CMG NDR Large Cap Momentum Index, remains in a sell signal. Trade Signals is posted each Wednesday. Here is a link to the Trade Signals blog page.
Personal Note
I hope your summer is going well.
I’m in NYC next Monday to meet with Barron’s and dinner follows with my friend John Mauldin. There is much to catch up on.
The beach follows August 13-20. Brie is coming down for the first weekend and Susan’s oldest boy Tyler is coming back from a grueling five weeks of training with the Navy. He is in ROTC at Cornell. What a kid. My youngest Kyle has been in the Colorado Rocky Mountains the last month and flies home next week. The gang is getting older and it is so much fun when we are all together. Let’s just say I’m not the first pick for the family beach volleyball team anymore.
I’ll be speaking on portfolio construction using ETFs at the Morningstar ETF Conference on September 7-9 in Chicago. Please let me know if you will be attending. Denver follows on September 13-15 where I’ll be attending a one day S&P Indexing Conference.
Wishing you and your family the very best! Relax. Have fun and don’t let the high valuations get you down. As Art Cashin says, “Stick with the drill – stay wary, alert and very, very nimble.”
If you find the On My Radar weekly research letter helpful, please tell a friend … they can sign up for the letter by clicking the “subscribe here” link that follows:
? If you are not signed up to receive my weekly On My Radar e-newsletter, you can subscribe here. ?
With kind regards,
Steve
Stephen B. Blumenthal
Chairman & CEO
CMG Capital Management Group, Inc.
Stephen Blumenthal founded CMG Capital Management Group in 1992 and serves today as its Chairman and CEO. Steve authors a free weekly e-letter entitled, On My Radar. Steve shares his views on macroeconomic research, valuations, portfolio construction, asset allocation and risk management.
The objective of the letter is to provide our investment advisors clients and professional investment managers with unique and relevant information that can be incorporated into their investment process to enhance performance and client communication.
Click here to receive his free weekly e-letter.


