
What returns do you expect from equity markets? What is realistic?
Many think a return north of 10% is what equity markets historically produce. If they are going to invest, they expect to see returns which better the markets. Some see reports that people have achieved returns over 25% and adjust their expectations accordingly. Actuaries, who set pension plan expectations, have recommended that long-term rates greater than 8.75% should be expected. Actuaries are supposed to provide conservative estimates. The data does not support this thinking and is there if one takes the time to review it,
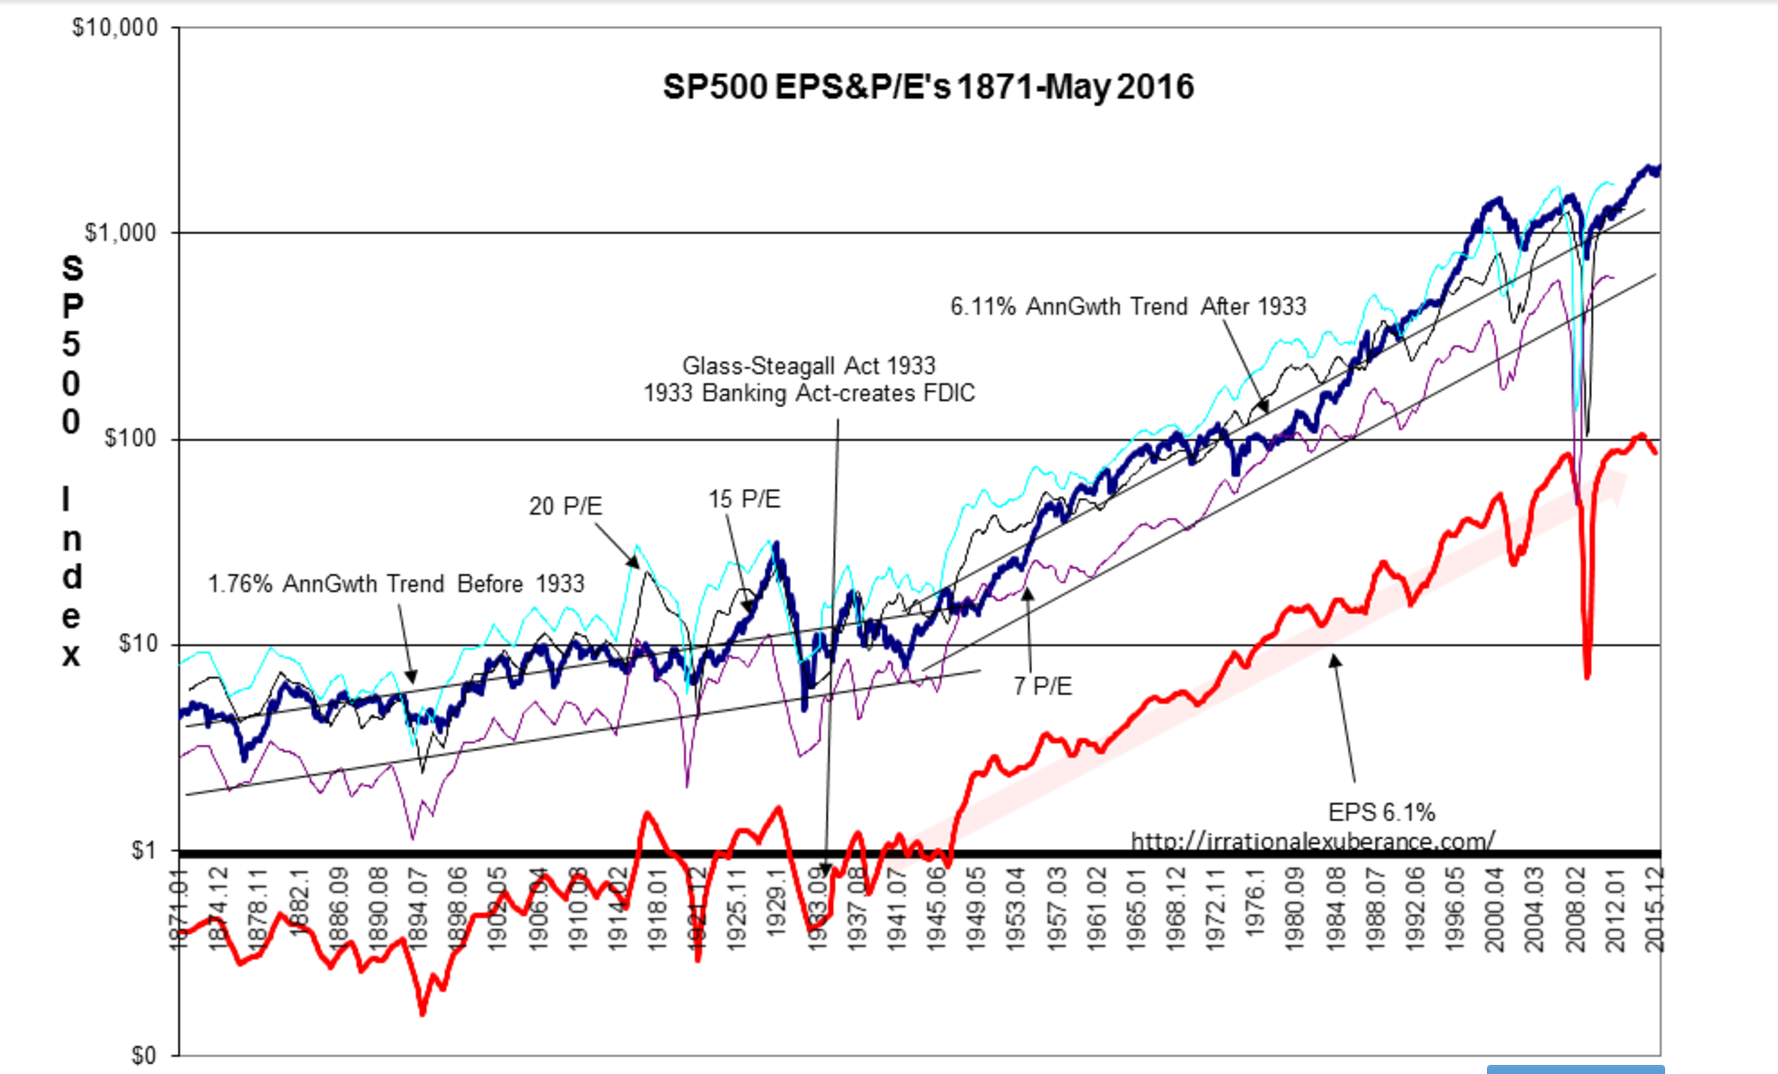
The SP500 ($SPY) performance is 6.1% from 1940-Present! It should be no surprise that SP500 performance is coupled directly to identical earnings growth of 6.1%. The much higher performance expectations of many investors is overly rosy. This occurs because so few have long-term perspectives and even fewer have compared earnings with market performance. Markets are human systems. Whenever the old rules have failed to protect participants from those who took advantage of others, we make new rules to solve the problem. 1933 saw such a rule change which substantially improved markets. That new regulation in 1933 was FDIC(Federal Deposit Insurance Corp.). It took the speculation which had been responsible for the elimination of the bank savings of the average and unsophisticated saver every time a bank failed and placed it where it belonged, on investors and speculators. It was about improving the fairness of financial services and how savers differed from speculators. The impact on the middle class and markets was very positive. We are always making new rules to solve fairness issues as markets evolve. Since 1933, no rule change has had the impact of FDIC. Something else becomes apparent with long-term perspective.
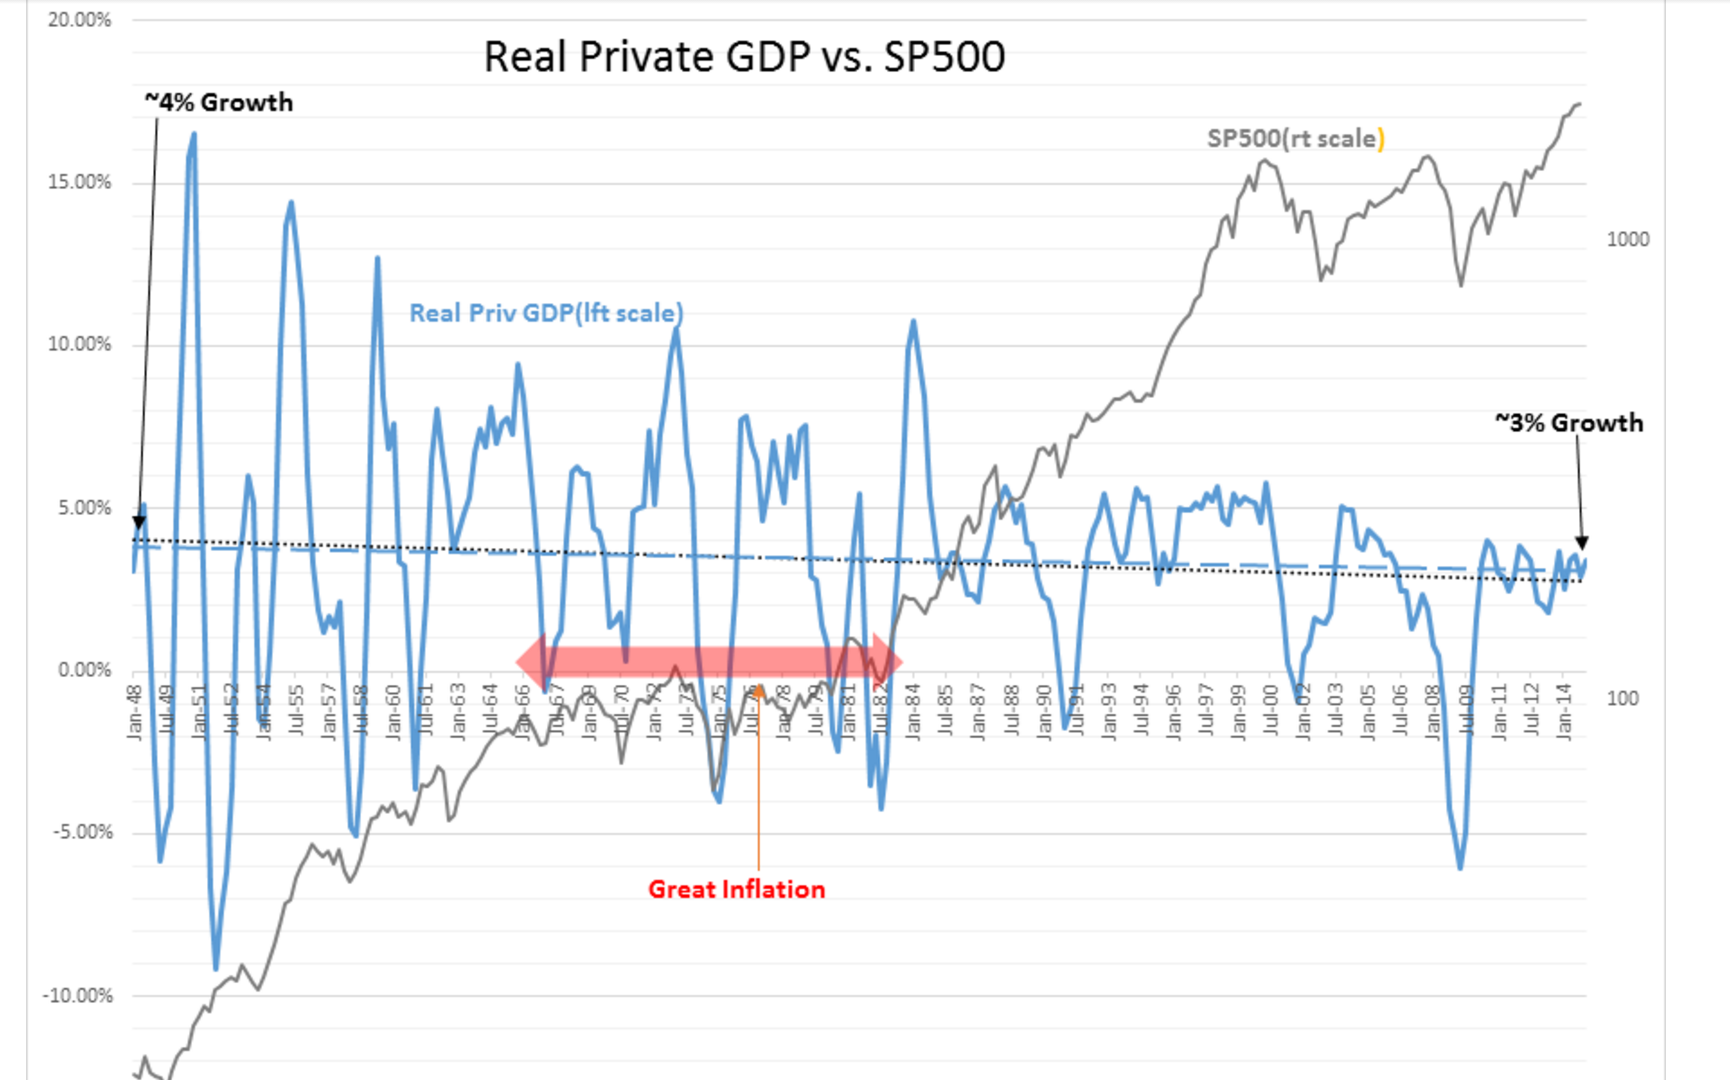
During the ‘Great Inflation’ of 1970-1982 P/Es fell from 20 to 7. Many equate this period as ‘stagflation’, i.e. a stagnant economy with inflation. Many believe today that business growth was slow during this period because markets only grew at an annual pace less than 2%. Using inflation adjusted data, the Real Private GDP shows that economic growth remained during the ‘Great Inflation’. What actually occurred was not slower economic growth. As inflation became recognized as more of an issue, investors valued the earnings at lower P/Es to compensate. While SP500 earningscontinued to grow at 6.1%, rising inflation lowered SP500 valuations at a negative -4.2% resulting in SP500 growth less than 2%. Even today, most investors refer to the 1970s as a period of very slow growth because of the impact investor revaluation impact had on SP500 performance. The facts are clear that Real Private GDP remained on trend while it was market P/Es which changed.
From 1982 to 1997 falling inflation reversed inflation’s impact. P/Es rose from 7 to 21. SP500 not only rose on 6.1% earnings growth during this period, it also had an annual average boost of ~6.4% as investors readjusted P/Es for a total annual performance for the period of ~12.5%. Many think of performance only in terms of market prices without taking into account earnings fundamentals and inflation’s impact. Actuaries only use market prices when setting future expectations. Investors would be better served having more realistic expectations. Since 1997, inflation has remained relatively stable in a range of 1%-3%.
Summary
Most investors have unrealistic expectations when it comes to market returns. Thinking that one should be able to achieve unrealistic returns often mentioned as achievable in the media leads to taking much higher risks than most can afford.
What really drives equity prices over time?
Markets are composites of investors of which there are two basic categories, i.e. Value Investors and Momentum Investors. Value Investors are long-term investors who focus on the details of business operations compared to general economic growth. Momentum Investors believe that market price trends are all one needs to determine what to invest in and how long. The overwhelming majority of what is heard day-to-day is that which comes from Momentum Investors. There are many, many more individuals who invest using short-term price momentum than there are individuals who invest long-term based on the details of business fundamentals. If one monitors investor media commentary across a market cycle, it becomes quite apparent that Value Investors buy and are optimistic at market lows while Momentum Investors are pessimistic and believe stocks should be shorted. At market tops their outlooks are reversed. With that in mind, I performed a study to determine how correlated was SP500 stock’s Price Growth to their Book Value per Share Growth (BV/Shr) from 2002 to 2008.
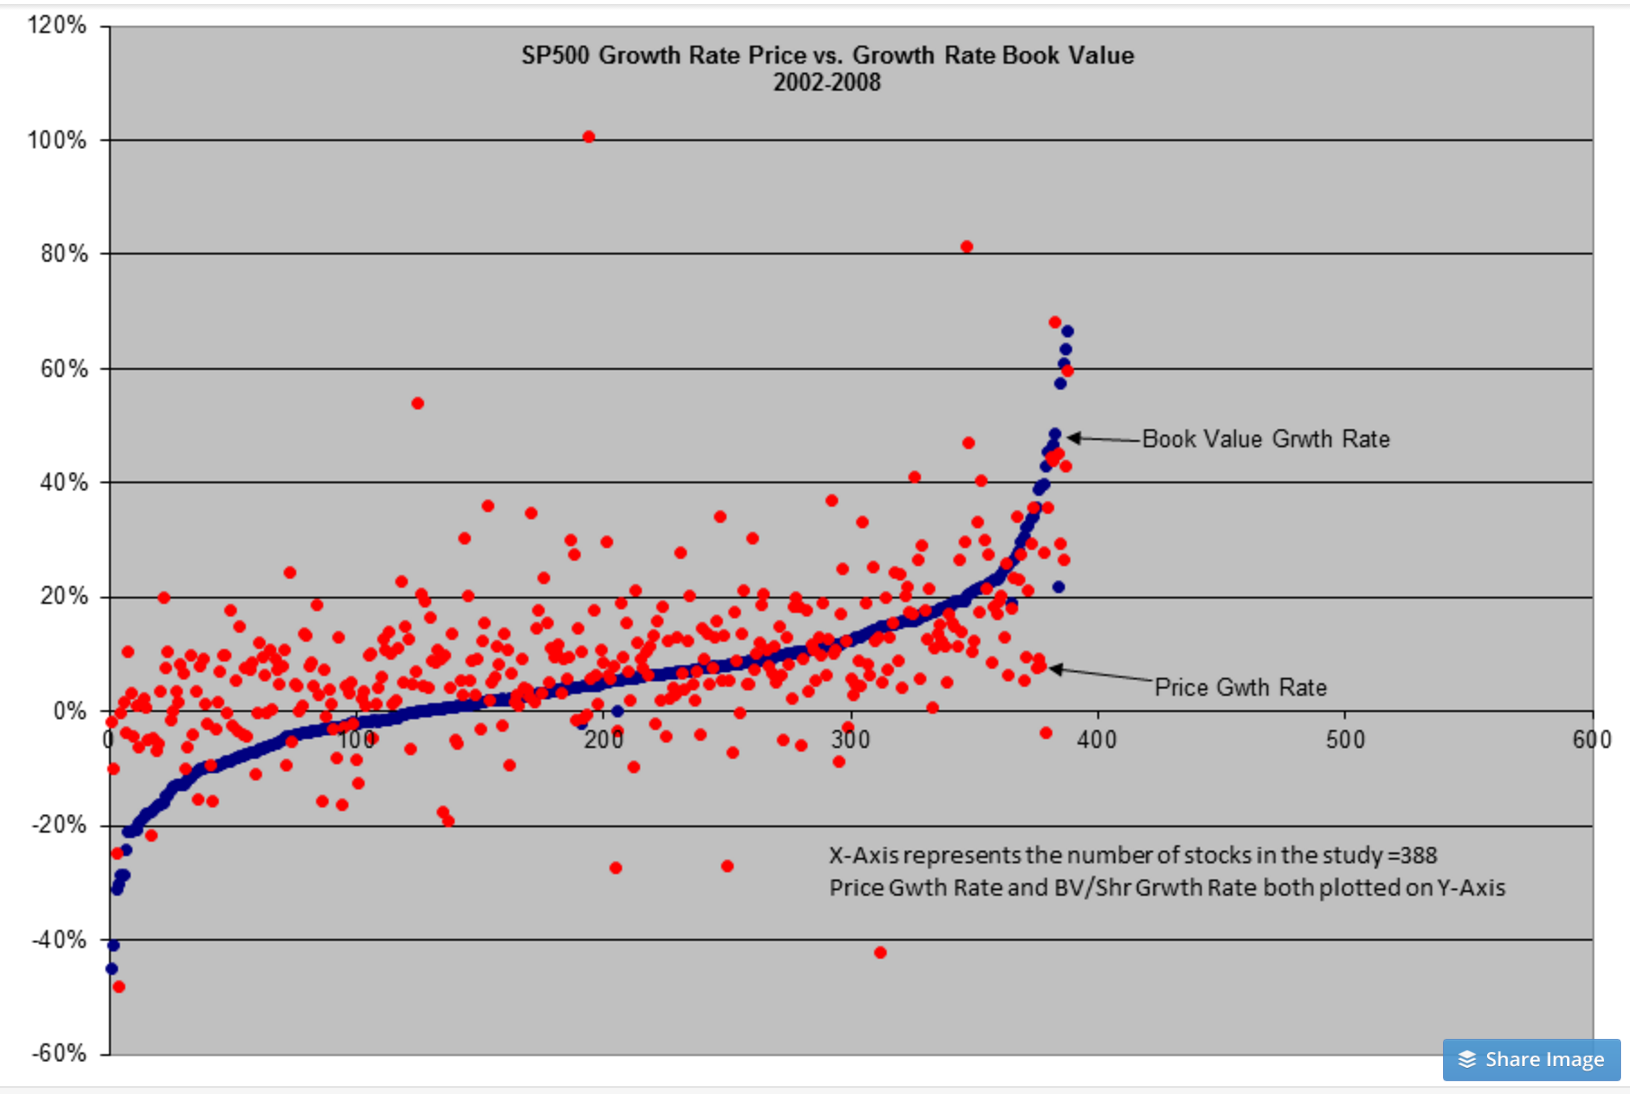
The study came to center on the 2002-2008 period and on BV/Shr. Narrowing to this period and business metric was the result of looking at various metrics, i.e. earnings, cash flow, and different periods in the range of 2001-2010. An strong correlation stood out only with BV/Shr in the 2002-2008 period. The regression analysis confirmed by a nationally acclaimed university business school revealed that the correlation between BV/Shr and Price growth was ‘highly significant’. The other metrics and periods were not even close. The BV/Shr and Price growth correlation is incredibly strong.
Shareholder Equity/Shr or BV/Shr represents the sum total result of all business activity if accounting has been fair. If a company is growing, after all costs of goods, salaries and income taxes have been paid, at the end of the day BV/Shr will be higher. Buffett has related his experience in his Uncle’s grocery store as a youth. At the end of the day, once the inventory had been replenished and bills paid, if one still had more cash in the till than when the day began, the business was growing. Value Investors view equities with this understanding. It is why Value Investors buy at market lows. The facts are, it is the buying by Value Investors and corporate insiders which create major market lows while Momentum Investors are most pessimistic. The use of BV/Shr as a business metric is not taught in business school. Today’s analysts dismiss this metric as useless.
In today’s markets we see many favoring so called ‘growth stocks’. They have received the acronym ‘F.A.N.G. stocks’. These companies are furiously growing revenue which many use as justification for high market prices. When one looks at BV/Shr growth, most do not have much growth at all and many have nothing but losses. They are spending everything they have to generate revenue with no growth in Shareholder Equity. The Internet stocks did the same in the late 1990s. Most of these do not exist today. Today we have electric vehicle companies, solar panel companies, Internet entertainment, Internet payment systems, Internet banks and lenders and others discussed as growth daily on CNBC. Companies who have histories of BV/Shr growth are rarely mentioned. Danaher(NYSE) is one of the least known of good companies.
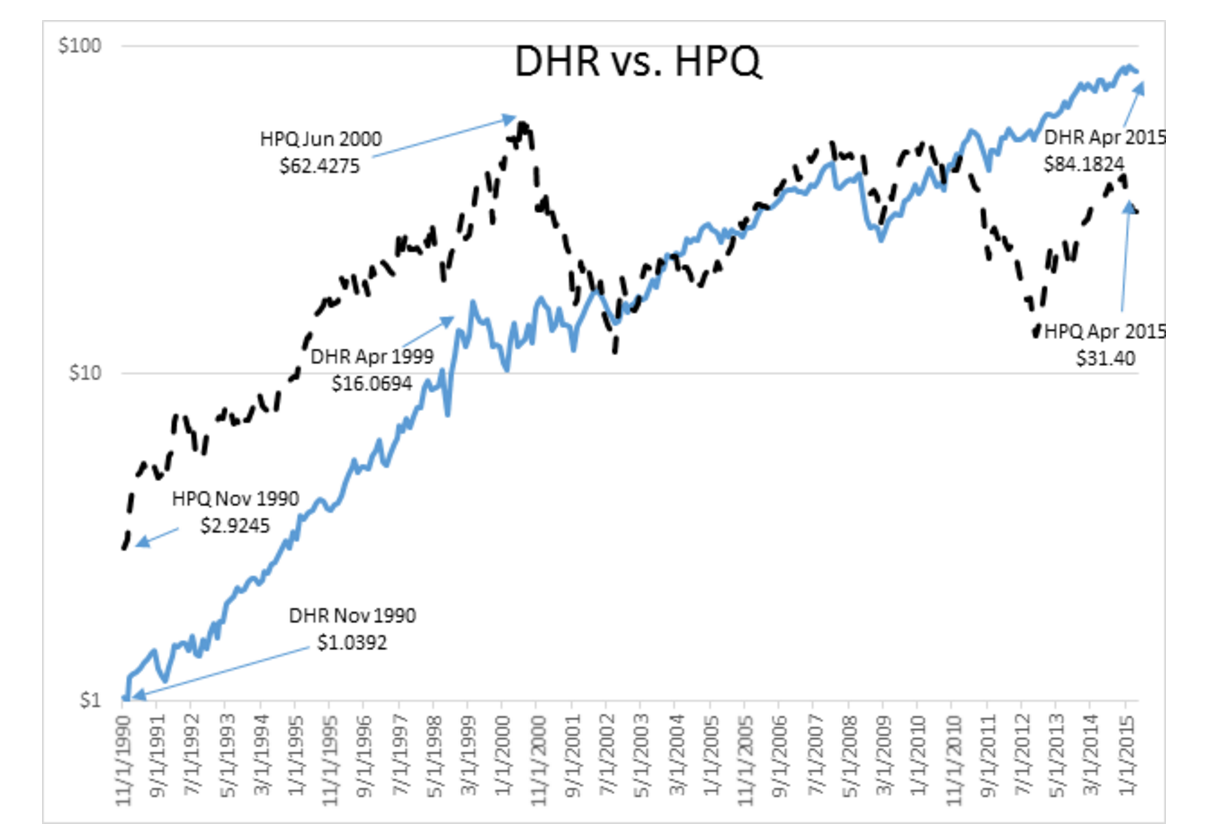
The chart of DHR(Danaher) vs. HPQ(Hewlett Packard) tells the multi-faceted story of market perception vs. business performance from Nov 1990 to April 2015. Danaher is a conglomerate of more than 1,000 companies(just split into Fortive and Danaher July 2, 2016) which makes many useful products but does this very, very well. Hewlett Packard is well known as a high-tech firm which makes computers, printers, servers and offers software and business services. DHR has grew from Nov 1990’s $1shr to $16shr in 1999 and then proceeded to grow to $84 in Apr 2015. HPQ grew rapidly early on also from Nov 1990’s $2.92shr to $62shr by Jun 2000 (just like many involved in the Internet build out in the 1990s) but gradually fell to $31shr April 2015 and today sits 50% lower at $14shr. Which is the growth company? Which do you hear about weekly as offering growth?
If one looks at the BV/Shr growth of DHR vs. HPQ, it will be clear that BV/Shr is strongly correlated to Price. Most investors are not aware Danaher even exists.
Summary
There are many misperceptions as to what drives stock prices. The actual driver is BV/Shr over the long-term. BV/Shr as a business metric is not taught in our business schools nor is it thought to have value on Wall Street.
Summary Summary
The range of misperception which characterizes our understanding of Top-down markets and economics and Bottom-up equity performance can only be categorized and broad and deep. Every day one is exposed to point and counter-point in the media each given with identical emphasis. The only solution is to stop listening for a while, collect the data of which there is much and work through it with discipline.
When investing one needs information without the noise. Investors require ‘noise filters’. This is what Value Investors do. Buffett and Munger are famous for saying that they spend most days reading and thinking…and thinking…and thinking some more.
Markets are simpler if one learns to view them long-term. Markets become even simpler once one is able to separate the $DHR from the $HPQ.


