
May 6, 2016
By Steve Blumenthal
“The Fed has borrowed from future consumption more than ever before. It is the least data dependent Fed in history. This is the longest deviation from historical norms in terms of Fed dovishness than I have ever seen in my career… This kind of myopia causes reckless behavior.”
-Stanley Drunkenmiller (source)
At the beginning of each month, I like to look at equity market valuations. The stock market moved higher in April, yet for the fourth quarter in a row, corporate earnings were down. The good news about market valuations is that they can tell us a great deal about the annualized returns we are likely to get over the coming 10 years. The bad news is they tell us little about returns over the coming two years.
Buy low — sell high, they say. Pretty simple actually, but not many can actually do it. This is where valuations can help us get centered. Below I provide examples from several periods – low valuations in February 2009 and the great gains since.
Valuations were high in 2000 and 2007 and, as you will see, the subsequent returns from those starting points were not good. There were some better entry points, like in early 2009 but, really, who do we know that bought back into stocks then? It was pure panic, margin calls and forced liquidations. I wrote a piece that prior December entitled, “It’s So Bad It’s Good.” I didn’t get many positive responses.
Yet, here we are today — valuations are now higher than they were in 2007. As you will see on the coming chart, they are higher than every other period in time with the exception of time surrounding the great tech bubble.
We are getting more than a few “you didn’t beat the market” phone calls like I’m sure you are getting as well. The reality today is much like 1999 and 2007, far too many investors with false confidence in hand are buyers – not sellers. Cited are the returns of the market over the last handful of years. Behaviorally, this feels hauntingly similar to those prior cyclical peaks. Lessons not learned.
I have been writing about the global overcapacity glut in the last several letters. Let’s pass on that, let’s pass on the debt mess, let’s pass on underfunded pensions and let’s pass on the Fed. Valuations do matter, so let’s go there.
Before we do, I want to weave in a few recent comments that crossed my desk this week – and likely yours – from Stanley Druckenmiller. Stan spoke this past week at the Ira Sohn Investment Conference. The CliffsNotes version of his presentation follow:
- He is negative on China’s economy going forward
- He believes further stimulus in the Asian country will not work as it has “aggravated the overcapacity in the economy” (SB here – to which I add globally aggravated along with the other central banks)
- “Get out of the stock market and own gold.”
And here is the big point as it relates to today’s overpriced stocks:
- Stan added, “U.S. corporations have not used debt in productive investments, but instead relied on financial engineering with over $2 trillion in acquisitions and stock buybacks in the last year.”
- “Corporate books show that operating cash flow growth in U.S. companies has gone negative year-over-year, while net debt has gone up.” (SB again – big buyers of U.S. stocks have been the corporations themselves. I believe they are near the end of that runway due to negative operating cash flow.)
- “Higher valuations, limits to further easing… the bull market is exhausting itself.”
Druckenmiller is the Babe Ruth of investing. One of the all-time greats. His performance record, I believe, may be unmatched. “Get out of stocks”… “Buy gold”… Try explaining that one to your clients.
Yet, like all of us, he is far from perfect (as he’ll tell you); however, we should pause and give consideration to what he is saying. Now, on to valuations.
Median P/E
Valuations can tell us a great deal about what the forward annualized returns over the coming 10 years are likely to be. My favorite metric is a price-to-earnings ratio measure called median P/E. I believe it to be a fair and consistent way to look at current valuations and compare on the same basis to historical valuations (email me if you want a deeper explanation). In this way, we can see what forward returns might likely be.
The rules remain simple. If the price is excessively high relative to earnings, then you are not getting a good bargain and won’t make as much money. If price is low relative to earnings, you get really good bang for your buck.
Here is a look at a few sample periods in history (you may have seen this chart from me before):

Take a look at the median P/E of 11.0 the month the market made its low in February 2009. Did most clients get 16.69% annualized return since then? Well, for those of you that had little money in the market or were in high school or college back then, here is what happened: MOST PEOPLE PANICKED AND GOT OUT at the LOW. The single biggest month of outflows on record occurred that month.
Show me the brave few who bought then. I don’t recall getting any calls asking why they did so much better than “the market” back then. I can show you the many who are buying in today. Makes no sense, but it might be best for me to jump off my soap box and get back to valuations.
Now, if you invested at the market top in the fall of 2007, the median P/E was at 19 and the S&P 500 peaked at 1549.38. The S&P 500 closed at 2065.30 at the end of April 2016. That’s about a 33% gain over eight years and seven months or an annualized total return of 5.86% per year.
Ok, so where are we today?
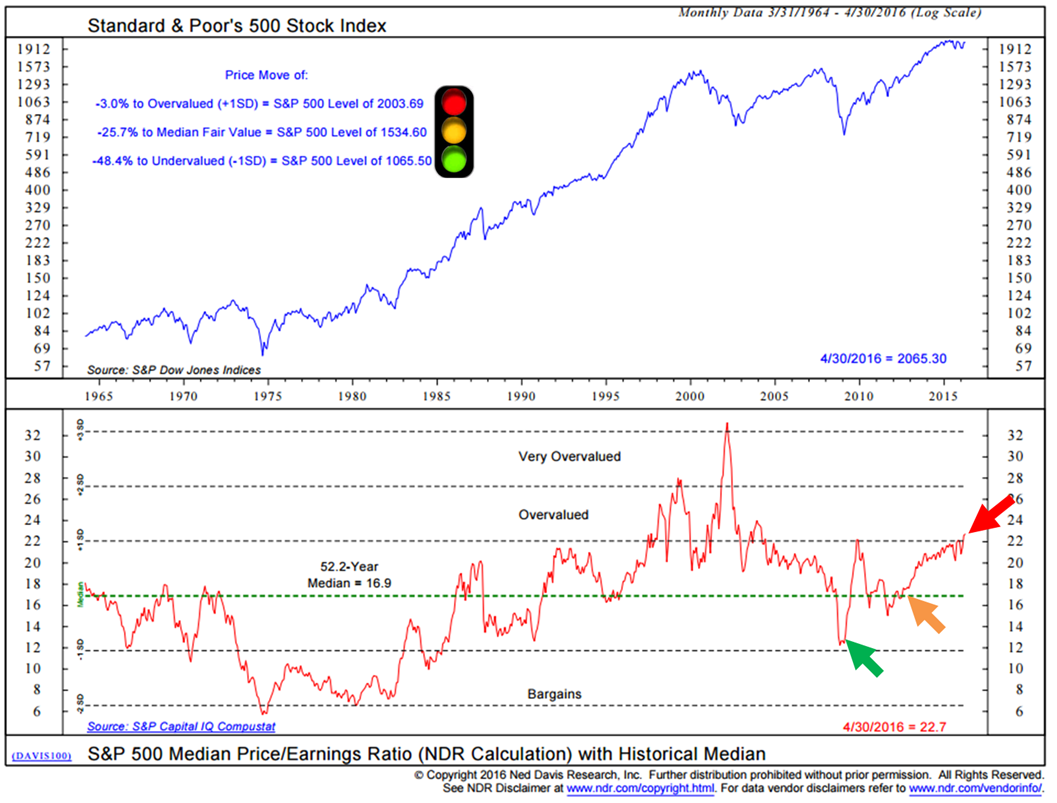
Median P/E reached 22.7 at the end of April. That is higher than any point looking at median P/E data from 1964 to present with the exception of the crazed pre- and post-tech bubble period.
The next chart is courtesy of Ned Davis Research. The traffic light and arrows are my notations as I attempt to simplify the chart. What I like about this chart is that it does a good job estimating overvalued, fair value and undervalued levels on the S&P 500 Index. Kind of an investor reality road map.
With the S&P 500 Index at 2065.30, it (by this measure) means that the market is overvalued by 3% (red light) by historical measures. In the chart, NDR uses a 1SD (standard deviation) move above fair value (it uses the 52.2 year median P/E of 16.9 to determine fair value) to identify the market as overvalued at 2003.69.
In English, a one standard deviation move is a movement away from a historical trend – it is something that doesn’t happen very often. In the case of median P/E, a 1SD move has happened about 10% of the time since 1964. Two SD moves happened about 2% of the time since 1964 (tech bubble). The point is they mark periods of extreme.
Fair value is determined to be 1534.60 (yellow light). Most of us would be happy with adding more to equities at that level and we’d be ecstatic to get really aggressive should the S&P 500 correct to 1065.50 (the green light).

Here is what the current high valuations are telling us about probable coming 10-year annualized returns. A median P/E of 22.7 puts us in the most expensive quintile (quintile 5) of all month-end median P/E readings dating back to 1926. The highest returns occurred when the market was inexpensively priced (quintile 1) and the lowest returns occurred when the market was expensively priced (quintile 5).
This week’s piece is solely focused on valuations (very high) and forward 10-year annualized return probabilities (very low). Share it with your clients; especially when they feel it is time to put more money into stocks. Hold up the stop sign and tell them “Stan Says Sell.”
Steve says reduce equity exposure, stay long bonds for now, overweight to tactical and liquid alternatives and hedge the equity exposure you may have. I know it will be hard for you to keep your clients on board with you if the market moves 10% or 15% higher before Stan is ultimately proven right.
Stan is well known for placing large amounts of money on a small number of bets. He is a speculator extraordinaire. He is quoted as saying “there are bulls, bears and pigs.” Further adding that he considers himself “a pig” – going “all in” on just a few targeted bets. Hard for most of us humans to do.
I’m a big Stan fan. He may or may not be right on this one but the hair on our arms should stand straight up when he issues such a clear and present danger warning. High valuations are flashing the same warning.
This week begins what I hope will be a shorter and more concise letter. During the week, I tweet out links to articles, charts or research that I find important. If you are interested, you can follow me on Twitter here.
If you want to take a deeper dive, click through to see several additional charts I share with you this week on valuations — price-to-sales, price-to-operating earnings, Shiller P/E, forward P/E and two really cool valuation charts that factor in low interest rates and inflation.
You’ll also find my “concluding thoughts” where I share a great quote from Sir John Templeton and tie it into why valuations matter.
Personal note:
Yesterday, I presented at a Bloomberg ETF Masters Forum in Philadelphia. ETFs are a great tool for you and me and for all investors. Goldman Sachs believes ETFs will grow to be $7 trillion in four short years (currently $2 trillion). They can do all kinds of things for your portfolio – trade up, trade down, high beta exposure, low beta exposure, find non-correlating return drivers, etc.
I presented on the ETFs we see leading in relative strength today and talked about the efficiency of trade execution. Notably, one of our recent trades sold a stock ETF and bought a gold ETF. I find myself rooting for Stan.
My two cents is to play it smart today and get prepared to be a great big buyer when the next correction creates the next great big investment opportunity. Until then, play solid defense.
Next week I’ll be in Las Vegas at the SALT Investment Conference. I’m really looking forward to seeing some old friends and the speaker lineup is fantastic. I’ll share some of my top takeaways with you next week. Mauldin’s Strategic Investment Conference follows in late May – Richard Fisher, James Grant, Lacy Hunt, David Rosenberg, Gary Shilling to name just a few. Can’t wait.
It’s been raining here in Philadelphia for way too many days in a row. Tomorrow night is prom night for two of our boys. Rain remains in the forecast — at least through Saturday so it’s looking like big umbrellas to keep that hair looking good. Big hair is back in style. Reminds me of the late 70s and early 80s (my prom days) but I can’t tell that to the boys, of course. “Right old man”, I can hear it now… Fun times as life races far too quickly forward.
Of course, there is the most important day of the year on Sunday – Mother’s Day. Our plan was to head to Stone Harbor (Jersey Shore) for the day, but with the poor weather, we’ll be celebrating Mom here at home.
By far the most important humans on the face of this earth are our mothers. I lost my mom way too long ago but I reach out to her with my heart frequently. I remember her hugs. What would we do without that unconditional love?
Wishing you a most wonderful Mother’s Day! And a special toast to your mom!
Have an outstanding weekend!
With kind regards,
Steve
Hey, if you find On My Radar helpful, please share it with a friend.
? If you are not signed up to receive my weekly On My Radar e-newsletter, you can subscribe here. ?
Included in this week’s On My Radar:
- Valuations – Median P/E, Price-to-Sales, Forward P/E and More
- Trade Signals – Markets Haven’t Liked Mondays Over The Last Five Years
Valuations – Median P/E, Price to Sales, Forward P/E and More
Over the last 52.2 years, the median P/E for the S&P 500 Index was 16.9. So at 22.7 (April 2016), the S&P 500 index is currently 25.7% above its median fair value. Today, based on this measure, fair value for the S&P 500 Index is at 1534.60.
I believe we’ll test that number at some point within the next 18 months. The market could go higher before it goes lower. To that end, valuations, while good risk/reward indicators, are not reliable timing indicators.
What I also like about the median P/E chart is that it shows overvalued levels and undervalued levels. Note the traffic sign I placed onto the chart (upper left) – red light, yellow light and green light. The market is overvalued at 2003.69 (red light), the market is fairly valued at 1538.62 (yellow light) and extremely undervalued 1065.5 (green light).
Median P/E:
Source: Ned Davis Research (NDR) (with stop sign and arrows added)
A quick commercial for Ned Davis Research. I’ve been a subscriber since the mid-1990s. They are an independent research firm. For independent advisor firms like mine, it’s like I have a full research team, in addition to my internal research team, at my back. I feel they are one of the strongest quant research firms in the business. We also use Bloomberg. I’m amazed at the depth of services. Both have charts on just about everything you can imagine. I have my favorites and check in on them frequently.
If you are interested in learning more about them, send me an email. I’ll direct you to the right person. Importantly, I am not compensated by NDR in any way. I’m just a long-time fan. Please see their disclosures.
In this next valuation chart, six independent valuations are combined and each month end represents the median of these six measures. When above 20 (the current reading is 40.43 – lower section of chart – bottom right), the gains for the S&P 500 six months, one, two, three and five years later are reflected. They are total gains not annualized gains. For example, when above 20 the gain over five years was 9.01% (shaded box bottom section of chart) so you are looking at annualized gains of less than 2% (date 1926 to April 2016).
That’s pretty cool data. One other takeaway is the dotted “normal” valuation line in the upper section of the chart. The blue line tracks the actual valuation vs. the normal valuation over the period 1926 to present. You can see how we go through periods of over and undervaluation.
Next is Price to Sales (same overvalued conclusion):
Next is Price to Operating Earnings (same overvalued conclusion):
Take a look at the returns in the upper left hand section of the above chart. The returns 3, 6, 9, 12 and 24 months later when the Price to Operating Earnings Ratio was above 18.2, like today at 20.73, were not good. Just saying…
Next is some commentary around forward P/E and history:
- Forward P/E, as of April 6, 2016, is estimated at 15.9
- 9 might look like a better number than median P/E of 22.9 but a forward 15.9 P/E is not good.
- It, too, is high from historical measures when you compare the current forward P/E to prior forward P/E readings.
- Forward P/E should be compared to the forward P/E numbers from other points in time. Likewise, median P/E should only be compared to historical median P/E.
- In the next chart, you can see the forward P/E (green dot, upper right) is higher than it was at the market peak in 2007. Then it peaked at 15 times earnings.
- Also note: forward P/E reached 22 in March 2000 (frankly, I doubt we’ll see that extreme overvaluation again… at least in my lifetime. But hey, I could be wrong. Either way, it’s a bad bet – I don’t like the odds).
Next is Profit Margins (this can help signal what is going on in the economy):
High prices and declining profit margins (declining earnings) do not mix well for investors.
As you can see in the yellow highlighted section at the upper left of the next chart, the economy does not do as well when profit margins are declining.
In this way, think of equities as an important leading indicator.
Summing up the current state of valuations:
- Median P/E, Price to GAAP Earnings, Price to Shiller Earnings, Price to Operating Earnings, Price to Forward Earnings, Price to Sales, Operating Earnings, Price to Book = Extreme Overvaluation.
- Part of the problem is that corporate earnings peaked in the second quarter of 2015. Another part is that debt financed equity buybacks have helped drive equity market prices higher.
- Lower earnings and higher prices mean we get a higher P/E ratio – or expensive hamburgers!
One last area that causes me concern is the high level of margin debt. I don’t know if it is from individuals borrowing from their stock brokerage accounts similar to how they used home equity lines of credit at the peak of the housing bubble or if they are aggressively invested in stocks but high margin debt – high any debt can be problematic.
When you combine overvalued markets with declining profit margins, high margin debt and questionable liquidity, markets have the tendency to unwind quickly. Declines trigger margins calls and, in many cases, this causes forced selling to meet those calls. Forced selling may trigger additional margin calls, which triggers more forced selling. More sellers than buyers… other buyers step out of the way and thus waterfall-like declines occur.
Conclusion: Reduce and hedge that equity exposure. Weave in other non-correlating diversifiers.
Finally, for fun (quant geek joke) take a look at these next two (way cool) charts courtesy of DShort.com.
Market Valuation, Inflation and Treasury Yields: Clues from the Past
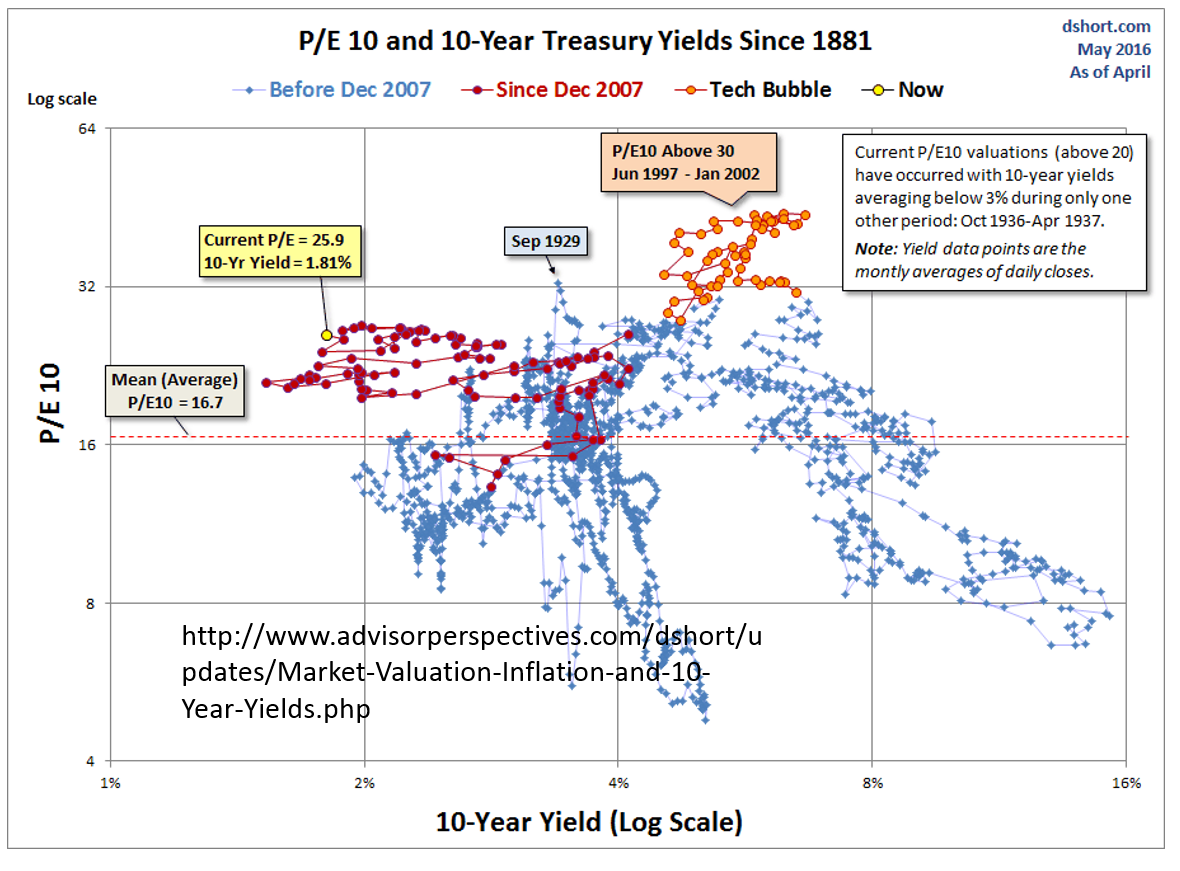
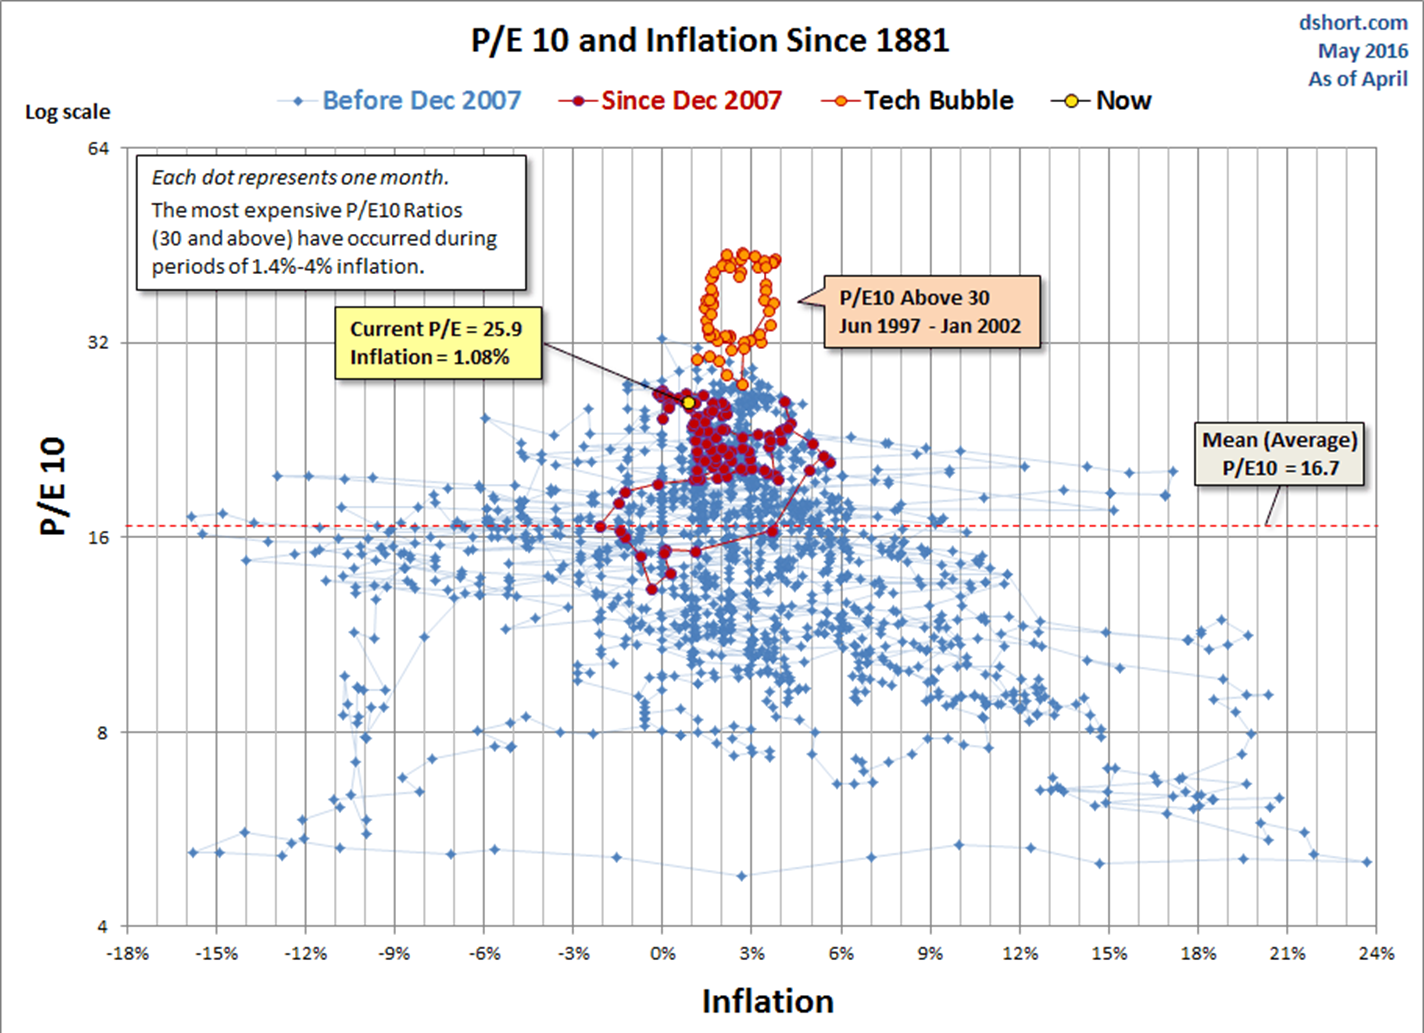
I really like Doug Short’s Advisor Perspectives blog. You can find more information here.
Trade Signals – Markets Haven’t Liked Mondays Over The Last Five Years
Sentiment is now neutral. Our CMG NDR Large Cap Momentum Index remains in a sell. The CMG Managed High Yield Bond Program moved to a sell signal this week. The trend chart for equities remains positive. The Zweig Bond Model remains bullish on bonds. You’ll also find updates on our CMG Opportunistic All Asset Strategy.
Here is a link to the Trade Signals blog page.
Concluding Thought
Why should valuations be on our radar right now? It is because 75% of the investable money will be controlled by pre-retirees and retirees by 2020 (according to Blackrock).
Even if we assume that they have saved enough, and that is mostly an inaccurate assumption, this age group (which I find myself in), dare I say, may not have the runway or stomach for the seven or so years that may be required to get back to even from the minus 30%, 40% or 50% stock market hit the next recession will bring. And recession will come.
If you can’t follow Stan’s advice and decide to just hold on tight in the next market storm, then know that you will be ok over the next 10 years. That is if 0% to 2% after inflation is ok with you (and you don’t need to touch the money).
Rather, my two cents is to play it smart today and get prepared to be a great big buyer when the next correction creates the next great big investment opportunity. Until then, play solid defense.
The great Sir John Templeton once told me that the secret to his success is that he “buys when everyone else is selling and sells when everyone else is buying.” It is ringing in my head today. He also added, “It sounds easy but it will be one of the most difficult things for you to do.” Amen, Sir John.
Let the historical math and common sense of median P/E valuations help show the way.
? If you are not signed up to receive my weekly On My Radar e-newsletter, you can subscribe here. ?
With kindest regards,
Steve
Stephen B. Blumenthal
Chairman & CEO
CMG Capital Management Group, Inc.


