“Davidson” submits:
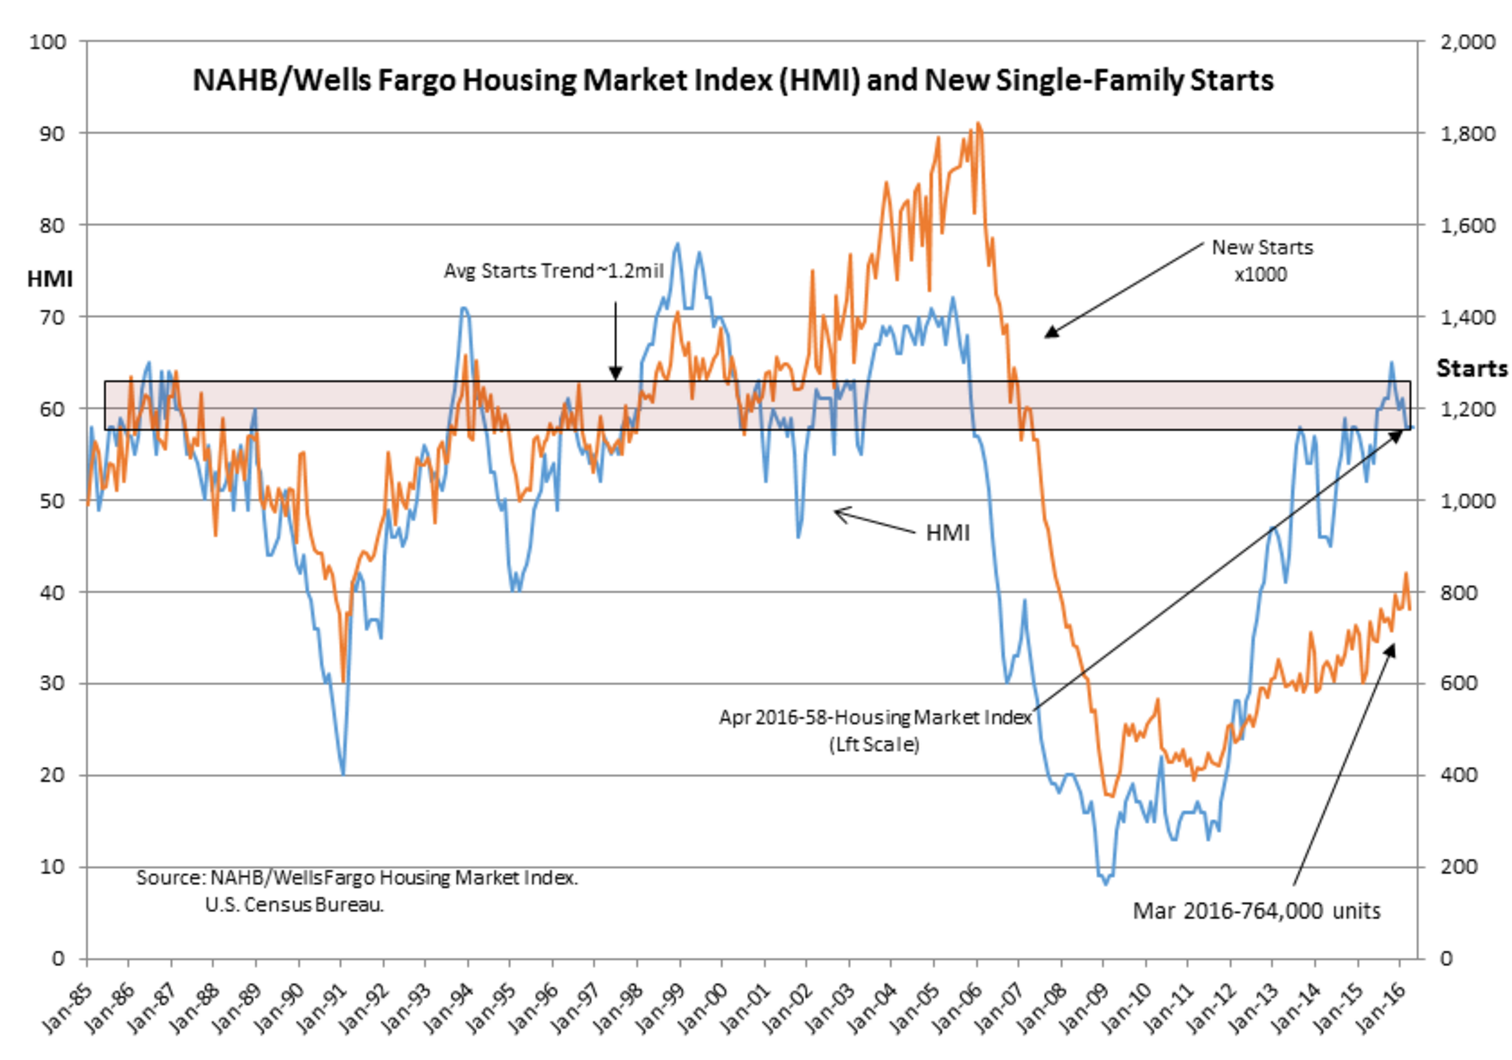
“Single-family housing starts in March were at a rate of 764,000; this is 9.2 percent (±10.3%)* below the revised February figure of
841,000.” https://www.census.gov/construction/nrc/pdf/newresconst.pdf
“U.S. housing starts fell more than expected in March and permits for future home construction hit a one-year low, suggesting some cooling in the housing market in line with signs of a sharp slowdown in economic growth in the first quarter.”
http://www.cnbc.com/2016/04/19/us-housing-starts-march-2016.html
The headlines were dour with this morning’s report on housing starts. No one could tell from what was said that housing remains on track and is not the disaster they say. Feb 2016 report of 822,000 was revised higher to 841,000. The data trend has a choppy pattern as one can see in the chart. The trend continues in a positive direction as does the HMI and other housing indicators.
Investors are spooked be every short term misinterpretation in the media. To truly understand economic activity one must step back and check the 6mo trend. While slower than previous recoveries due to heavy handed regulation of banks and Fed manipulation of mtg rates to levels which create a tight credit environment, housing is still trending higher and at the current pact may still have several years ahead if the Fed does not shut lending down with short term rate hikes. Short term rate hikes on a very tight T-Bill to 10yr Treasury spreads of 1.5% only reduces mtg lending with is currently 1/3 what can be considered a normal recovery level.