
By Steve Blumenthal
“If zero or negative interest rates actually fixed what’s broken in the economy, we’d all be living in Paradise after seven years of zero interest rates.”
– Charles Hugh Smith (blog)
I am up early, in my favorite chair and loving the coffee that Susan just made for me. It’s quiet and it’s Friday. Happy. I hope you are as well.
Ticking down the check list, following is my personal view on what is happening in the markets and what the road ahead may look like:
- The commodity bear market remains. Started in 2011, the average bear market lasts approximately 19 years.
- Oil is a mess (except for you and me and our wallets at the gas pump). Overall, still an economic drag as billions of dollars in projects are shelved and high-paying jobs are lost – though lower oil and gasoline prices are a positive for the consumer.
- The Fed – still leaning higher on rates, but I see them on their way to going lower. The talk of negative rate messaging is purposeful and, in my view, concerning (see quote above and see a link below to an important article by Ray Dalio).
- The equity bear market remains the dominant trend. As indicated by our CMG Ned Davis Research Large Cap Momentum Index and general price trend data (see Trade Signals below). The technical’s around the three day rally look weak.
- Equity valuations remain high. Probable forward 10-year returns remain low.
- The asset classes showing the strongest relative strength are Utilities, Government Bonds, Muni Bonds and Gold.
- Global recession – yes. S. Recession – not yet. Getting the timing right is critical to our collective wealth and future opportunity.
One of our advisor clients called me and asked for my thoughts on what the high-yield bond market may be telling us about recession. For what it’s worth, I shared the following:
My nearly 25 years of trading HY has taught me that the sector is a good leading indicator for the equity market and the economy. I believe that, in general, bond managers are really on top of their individually-held corporate credits (bonds). As you’ll see in the next chart, the major long-term trend for HY is down. This is concerning to me.

As prices decline, yields go higher and that spread relative to safer bonds like Treasurys is going up. That is a sign of potential trouble for companies. To this end, the overall default rate is rising and expected to reach a six-year high in 2016 and junk bond stress is spreading beyond energy (according to Moody’s).
In my view, severe stress will present when the money is due to be paid back. Post the great financial crisis, many companies found it easy to refinance and at lower interest rates. However, too many not-so-qualified borrowers found funding and at low rates. A number, including many in the energy space, are on life support and in need of refinancing. Nearly half of the $2 trillion total in the high-yield market is set to mature between 2016 and 2020. Refinancing will be impossible for some (defaults will spike) and be difficult for others. As investors, the probable sell-off will create our next investment opportunity!
Further concerns include the European and U.S. domestic banks that carry loan risk on their books. There is concentrated loan exposure to the oil and gas industry. Banks are highly leveraged businesses. We have reliable word that banks are marking down those loans on their books. These institutions are highly regulated. Once one starts, they all must get real. I expect we’ll see poor bank earnings numbers in April. One has to wonder why they waited until the first quarter of the 2016? 2015 incentive bonus’s anyone.
The behavior of bank stocks (such as SPDR S&P Bank ETF “KBE”) and iShares MSCI Europe Financials ETF (“EUFN”) relative to the S&P 500® (“SPY”) may be telling us something. Consider it a data point and let’s revisit this post come April’s earnings season.
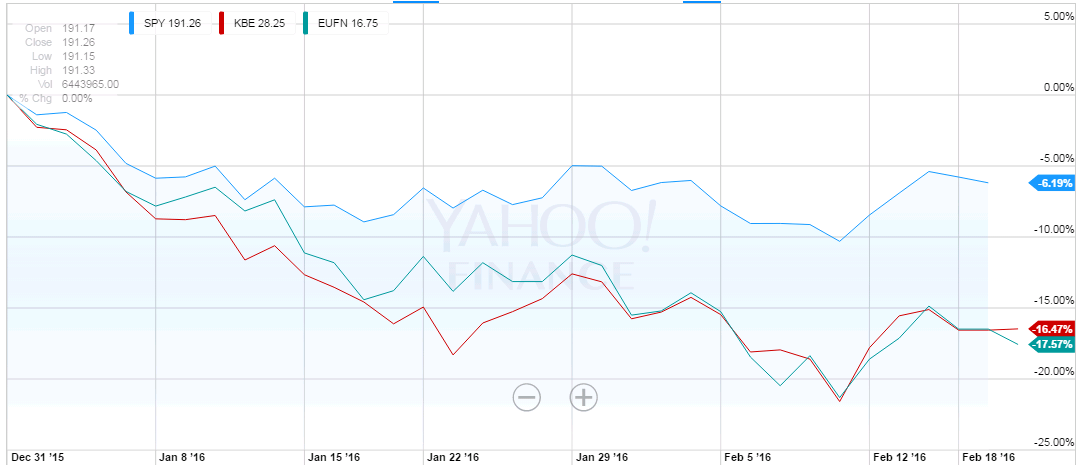
Source: Yahoo! Finance
I conclude that recession holds the key to whether we see a short-term correction in the -15% to -20% range (maybe now behind us) or the -40% to -60% range. Either way, I believe valuations are high. Expect low forward returns from both equities and bonds.
Underweight equity exposure (and hedge that exposure), allocate to bonds (tactically) and overweight to tactical and other liquid alternative strategies and funds, such as managed futures, global macro and long/short equity.
I just can’t keep the opening quote out of my mind, “If zero or negative interest rates actually fixed what’s broken in the economy, we’d all be living in Paradise after seven years of zero interest rates.” Zero interest rates will hurt all of us.
Keep front of mind that we are living in a highly unusual central bank-influenced period in time. Untested and unknown.
I recommend you read Dalio’s piece below. He is the founder of Bridgewater Associates. Dalio and his team manage the world’s largest hedge fund ($154 billion in global investments). He looks forward to the next version of monetary policy. Helicopter money. As for John Hussman’s post, “Warning with a Capital ‘W”, drink something strong before you jump in. Don’t panic – just hedge, overweight to non-directionally dependent strategies and remain patient.
Patience and defense will pay off and hopefully keep your client firmly seated and on-plan through what may likely be a very bumpy ride.
To that end, ETF.com published an article I wrote entitled, “When Beating The Market Isn’t The Point”. Please feel free to share it with your clients. I hope you find it helpful.
? If you are not signed up to receive my weekly On My Radar e-newsletter, you can subscribe here. ?
Included in this week’s On My Radar:
- What Monetary Policy 3 Will Look Like, By Ray Dalio
- Recession Watch Update
- Hussman – “Warning with a Capital ‘W’”
- Trade Signals – Primary Trend is Bearish, Rally Target (S&P 500: 1950 Key Technical Level) – Blog post 02-17-2016
“What Monetary Policy 3 Will Look Like,” by Ray Dalio
Monetary Policy 1 was via interest rates. Monetary Policy 2 was via quantitative easing. It will be important for policy makers and us as investors to envision what Monetary Policy 3 (MP3) will look like.
While monetary policy in the US/dollar has not fully run its course and lowering interest rates and quantitative easing can still rally markets and boost the economy a bit, the Fed’s ability to stimulate via these tools is weaker than it has ever been. The BoJ’s and ECB’s abilities are even weaker. As a result, central banks will increasingly be “pushing on a string.” Let’s take just a moment to review the mechanics of why and then go on to see what MP3 will look like.
Why “Pushing on a String?”
Lending in order to finance spending requires both investors/savers and borrowers/spenders, who have very different objectives, to each operate in both their own interests and in a symbiotic way. For example, when a debt expansion that finances spending on goods and services takes place, both a) the investors/savers increase their debt holdings because they believe that they are increasing their assets, and b) the borrowers produce those borrowings (that investors/savers call an ‘asset’) to increase their spending. When both are going on in a big way (i.e., when debts, financial assets, and spending are rising fast), we have a boom. However, because both savers and borrowers often don’t do the calculations very well to determine whether the debt created will be used to produce more than enough income to service the debts, we also have busts. So, to understand how central banks’ monetary policies work, one has to see things through the eyes of both investors/savers and borrowers/spenders.
I will look at the process from the investment side, as that is now more important because central bank policies, especially quantitative easing, have their effects more by affecting the behavior of investors/savers than by affecting the behavior of borrowers/spenders. When the central bank buys a bond, it does so from a saver/investor who takes the cash to make an alternative investment decision. What they invest/save in makes all the difference in the world. When investing/saving is in the sort of assets that finance spending, that stimulates the economy. However, when investing in that sort of asset is unattractive, which is what happens when the “risk premiums” are low and/or investors are scared, it does not. To the extent that interest rates decline, that also has a positive effect on all asset prices because all investments are exchanges of lump sum payments for a stream of future cash flows, and the interest rate (i.e., the discount rate) is the rate that is used to calculate the present value of these cash flows. All else being equal, the more interest rates are pushed down, the more asset prices will be pushed up. That is how monetary policy now works.
So, Where Do Things Now Stand?
The discount rate is just about as compressed as it can be, so the potential present value effect of lowering it is nearly at its end. That’s a big thing. In terms of the risk premiums of “risky assets,” they’re now neither especially high nor low, so there is a bit more to be squeezed out of them, more so in the US than elsewhere. Put these two pieces together and it’s clear that the future returns of assets will be low, which will be a problem given what the returns need to be to meet our future obligations. Though not pressing, that issue is something that central banks will have to deal with, which helps to inform the picture of what MP3 will probably look like—i.e., they will need more “money printing.” From the perspective of an investor, if you look at the level of the returns relative to levels of volatility, the expected reward-risk could make those who are long a lot of assets view that terrible-returning asset called cash as appealing.
To clarify, take current bond yields (less than 2%) and cash (0%) and compare that to something like a 4% expected return on equities. Because of volatility, the 4% expected annual return pick up of equities over cash, or 2% over bonds, can be lost in a day or two. (For example, stocks fell by nearly 5% in a week earlier this month.) And then there is the feedback loop where a sell-off in the stock market in turn has a negative pass-through effect on the rate of economic activity. All that makes for asymmetric risks on the downside in the US—and the pictures in other countries are even more asymmetrical on the downside, as their interest rates are even lower and their risk premiums are nearly gone.
The mechanics of how currencies, interest rates, and economies work together is also important to understand at this time as they will have a big effect. Remember that all debt is a promise to deliver a specific currency, so when the currency gets more or less valuable, it affects people’s behaviors. That is true now more than ever because those who have money are exposed to alternative currencies to keep their wealth in (or to borrow in) and because the major currency systems are all in fiat currency. So more money than ever will move from one currency to another, or from currencies to other assets (e.g., gold), based on what people are thinking about how the values of currencies will change. Also we should expect currency volatility to be greater than normal because 1) when interest rates can’t be lowered and relative interest rates can’t be changed, currency movements must be larger, and 2) when both relative interest rates and relative currency movements are locked together (e.g., in European countries and wherever there are pegged exchange rates), relative economic movements must be larger. Said differently, to avoid economic volatility, currency movements must be larger. That reality creates “currency wars,” pegged exchange rate break-ups, and increased currency risk for investors. Because currency movements benefit one country at the expense of another (e.g., they’re beggar-thy-neighbor), if the world’s largest economies all face the difficulty of pushing on a string, exchange rate shifts won’t create a needed global easing. Nobody intends these wars to happen. That’s just how the economic machine works.
For these reasons investors should expect to experience lower than normal returns with greater than normal risk.
Asset prices have fallen largely as a result of this, together with the deflationary pressures brought about by most economies being in the later stages of their long term debt cycles.
So, how might the current decline in risky assets transpire? That depends on what levels risky assets need to decline to in order to raise their risk premiums enough to cause investors who have a long bias (which most all have) to take their cash holdings (or to borrow cash) to add to those assets. With the central banks’ abilities to be effective in easing to reverse a downturn weaker than before, the past may not be a good guide because the self-reinforcing cycle of falling asset prices having negative economic effects may not be as easily reversed as in more normal times. In other words, the downside risks are greater. That doesn’t mean that a downturn is likely—it’s just that the risks are asymmetrical if one does.
Most likely, as risk premiums increase, central banks will increasingly ease via more negative interest rates and more QE, and these moves will have a beneficial effect. However, I also believe that QE will be less and less effective because there is less “gas in the tank.” To convey how much gas they have left in the tank, we created an index based on the previously described drivers. It is shown below for the US since 1920 and for Euroland and Japan since 1975. As shown, for the US it is as low as ever and approximately the same as in 1937. Because of this, we think that the 1937-38 period, though not identical, is the most analogous period to look at when thinking about interest rates, currency rates, monetary policies, and global economic activity. It, and the mechanics behind it, are worth understanding.
Ray Dalio: What Will Monetary Policy 3 Look Like?
While negative interest rates will make cash a bit less attractive (but not much), it won’t drive investors/savers to buy the sort of assets that will finance spending. And while QE will push asset prices somewhat higher, investors/savers will still want to save, lenders will still be cautious lenders, and cautious borrowers will remain cautious, so we will still have “pushing on a string.” As a result, Monetary Policy 3 will have to be directed at spenders more than at investors/savers. In other words, it will provide money to spenders and incentives for them to spend it. How exactly that will work has to be determined. However, we can say that the range will extend from classic fiscal/monetary policy coordination (in which debt to finance government spending will be monetized) to sending people cash directly (i.e., helicopter money), and will likely fall somewhere between these two (i.e., sending people money tied to spending incentives).
To be clear, we are not describing what will happen tomorrow or what we are recommending, and we aren’t sure about what will happen over the near term. We are just describing a) how we believe the economic machine works, b) roughly where we believe that leaves us, and c) what these circumstances will probably drive policy makers to do—most importantly that central bankers need to put their thinking caps on.
U.S. Recession Watch Update
Actual recessions are marked in gray in the lower section of the next chart. The NDR Economic Timing Model consists of 27 different economic indicators (many of which are featured in the Economic Service). Each indicator in the model monitors a different sector of the economy and rates that sector’s monthly performance with a positive or a negative signal. The individual signals are tabulated to give us the current monthly readings, which range from a maximum favorable reading of +27 to a maximum unfavorable reading of -27. When the model drops from positive to negative, it indicates that a recession may be imminent. Source: NDR
No U.S. recession just yet, but note how quickly the red line can drop.
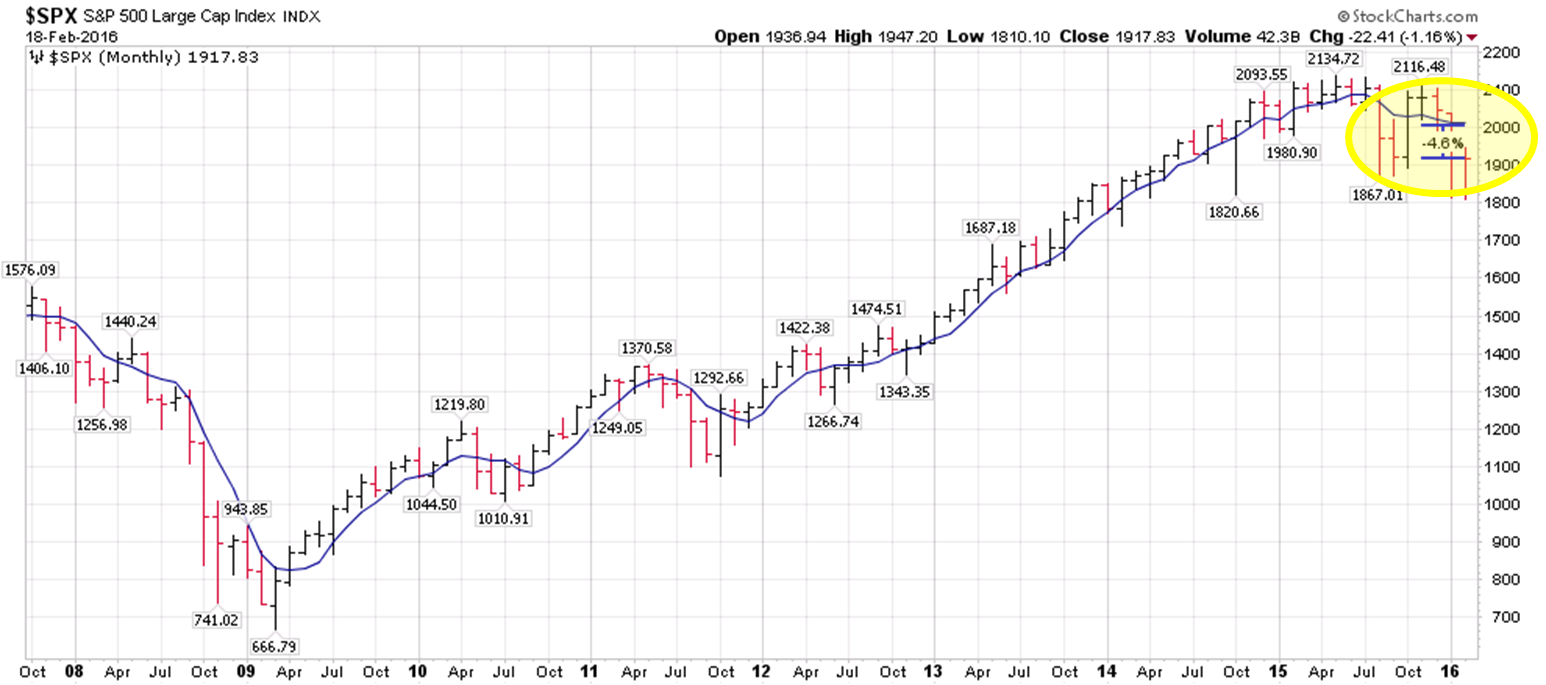
What many don’t know is that the stock market is a leading (not lagging) economic indicator. Following is my favorite recession watch indicator with a 79% historical “correct signal” rate. I update the output of this data each week in Trade Signals. Not perfect… though nothing is.
The chart is calculated with month-end data. Required for a contraction signal is a drop of 4.8% below the S&P 500® Index’s five-month smoothing (think Moving Average line). Currently, the S&P 500® stands at about 4.6% below its five-month MA.
The equity markets decline 40%, 50%, 60% or more during recessions. Worth watching and doing our best to get in front of, I believe.
Next is an inter-month updated estimate of the above process. Close…
My conclusion: No U.S. recession signal yet. The consumer remains relatively strong and consumption drives about two-thirds of our economy. Prices at the pump must be helping.
But forward we must set our gaze – the risk of recession is rising.
As a quick aside: Jimmy Rogers was on CNN last week. He made his fortune several times over by investing where others feared to tread. He made a name for himself in the 1970s after co-founding a top-performing fund with George Soros.
He is sharp yet sometimes controversial. I’ve read several of his books and always find myself interested in what he has to say. Following is his two cents:
- “We’re all going to pay a horrible price for the incompetence of these central bankers,” Jim Rogers said Monday in a TV interview with CNNMoney’s Nina dos Santos. “We got a bunch of academics and bureaucrats who don’t have a clue what they’re doing.”
- He predicts their unconventional monetary strategies will lead to a stock market rally in the near future, but deep trouble later this year and into 2017.
- “It’s been over seven years since we’ve had a decent correction in the American stock market. That’s not normal … Markets are supposed to correct. We’re supposed to have economic slowdowns. That’s the way the world has always worked. But these guys think they’re smarter than the market. They’re not.”
- “You should be very worried and you should be prepared.” Source
“Warning with a Capital ‘W,’” by John Hussman
I know you may have or continue to have an allocation in one of John’s mutual funds. He missed getting long again in 2009. That stung both his investors and him. My advice is to not let that sour taste get in the way of some very sound research. No one is perfect in this game – thus we diversify to a number of different risks.
John begins, “We continue to classify the prospective equity market return/risk profile within the most negative climate we identify. The basis of this classification is fairly straightforward. Historically, once an extended speculative period of extreme overvalued, overbought, overbullish conditions gives way to increasing risk-aversion, as indicated by deterioration in market internals (and particularly in the presence of hostile yield trends in the form of widening credit spreads), the stock market has become vulnerable to vertical losses. Though not every instance of this syndrome has been followed by a market collapse, every notable panic and market crash across more than a century of data has featured that basic setup.”
Remove all sharp objects and click the link to read John’s latest piece titled, Warning with a Capital “W”.
We have created several educational pieces and white papers. We hope you find them helpful in your work with your clients.
- When Beating the Market Isn’t the Point
- Correlation, Diversification and Investment Success
- The Merciless Math of Loss(this is about how compound interest works for you)
- Here is a link to our Advisor Blog page
- Here is a link to our Advisor Resource page
Trade Signals – Primary Trend is Bearish, Rally Target (S&P 500: 1950 Key Technical Level) – Blog posted 02-17-2016
S&P 500® Index 1922
By Steve Blumenthal
February 17, 2016
The trend remains negative for equities and is neutral for high yield. Investor sentiment remains extremely pessimistic. Such extreme readings are generally bullish for equites. We are finally seeing the oversold rally.
The S&P 500® Index is nearing its February high at 1947.20. The 50-day moving average line (trending lower) is currently at 1960. I favor establishing hedges on equity exposure in the 1925 to 1960 area.
Overall, the major trend remains bearish and the market remains expensively priced. In last week’s “On My Radar,” I shared some stats on past bear market corrections that may help put the current indigestion into perspective. They are pretty interesting. You can find them here.
Included in this week’s Trade Signals:
Equity Trade Signals:
- CMG Ned Davis Research (NDR) Large Cap Momentum Index: Sell Signal – Bearish for Equities
- Long-term Trend (13/34-Week EMA) on the S&P 500®Index: Sell Signal – Bearish for Equities
- Volume Demand is greater than Volume Supply: Sell Signal – Bearish for Equities
- NDR Big Mo: See note below (active signal: sell signal on 1-15-16).
Investor Sentiment Indicators:
- NDR Crowd Sentiment Poll: Extreme Pessimism (short-term Bullish for Equities)
- Daily Trading Sentiment Composite: Extreme Pessimism (short-term Bullish for Equities)
Fixed Income Trade Signals:
- The Zweig Bond Model: Sell Signal
- High-Yield Model: Neutral
Economic Indicators:
- Don’t Fight the Tape or the Fed: Indicator Reading = 0 (Neutral for Equities)
- Global Recession Watch Indicator – High Global Recession Risk (85.7% Probability)
- U.S. Recession Watch Indicator – Low U.S. Recession Risk
(S&P 500® Index monthly declines of -4.8% or greater below its 5-month smoothing (MA) signaled recession 79% of the time: 1948 – Present). Data is updated each month end.
Currently -4.1% below 5-month smoothed moving average.
Tactical — CMG Opportunistic All Asset Strategy:
- Relative Strength Leadership Trends: Utilities, Fixed Income, Muni Bonds and Gold are showing the strongest relative strength:
Personal note
Your portfolios probably have an allocation weighting to global equities. So I found it interesting and logically sound that bear markets, historically, were more severe when the global economy and U.S. were both in recession at the same time. The MSCI All Country World Index (ex – U.S. stocks) had an average drawdown of 48.6%. The MSCI ACWI (which includes a weighting to U.S. stocks) had an average drawdown of 45.2%.
My personal view is that we are currently in a global recession yet the U.S. is not yet in recession (though likely near). I sense that the confidence placed in global central bankers is waning. It feels to me much like it did in 2007. We are overdue for an economic recession. Likely this year or next. Recessions create moments of chaos. We will be called upon to bring peace in the next moment of chaos. That will be easier to do if the collective set of diverse risks set in place, in the portfolio creation process, do their job.
I believe that you and I will once again be called on to help others find peace. Going into the game prepared with game plan in hand, in my view, is critical. It will help with the finding peace part and should help with the seizing the opportunity part.
Naples, Florida is up next on February 29. I’m attending the CBOE Risk Management Conference. We do a lot of hedging within one of our equity funds and I’m looking forward to a spirited few days. We trade ETF-based options and have experienced first-hand the growth in liquidity, trading volume and the tightening in bid/ask spreads. I’m looking forward to learning more.
Dallas follows in the first week of March for a mutual fund gathering of key platform decision-makers. I will travel to Indianapolis in mid-March for an advisor’s client event and to San Francisco on March 23 and 24 for several meetings. I just booked three nights in Vail. It is just me and my boys. Though I’m going to try to twist Brianna’s arm. From there we drive to Denver for several advisor meetings and an afternoon touring the University of Colorado – Boulder. My Matthew is a high school junior and crazy about skiing… so CU is on his mind. Though I’m doing my best to brainwash him on Penn State.
Wishing you an outstanding weekend! It is supposed to be 55 degrees and sunny here in Philadelphia!
? If you are not signed up to receive my weekly On My Radar e-newsletter, you can subscribe here. ?
With kind regards,
Steve
Stephen B. Blumenthal
Chairman & CEO
CMG Capital Management Group, Inc.


