
February 12, 2016
By Steve Blumenthal
“Goldman Sachs Abandons Five of Six ‘Top Trade’ Calls for 2016”
February 9, 2016 Bloomberg News
From Financial Advisor Magazine:
“The dollar versus a basket of euro and yen; yields on Italian bonds versus their German counterparts; U.S. inflation expectations: Goldman Sachs Group Inc. was wrong on all that and more.
The fumbles underscore the volatility that has beset global markets, accelerating price swings across currencies, stocks and bonds. Signs the world economy is suffering amid a slowdown in China have fueled unease about the creditworthiness of banks and other corporations, spurring a bid for haven assets such as the yen and the euro.”
These are some pretty smart people. We are just six weeks into the new year. It caught my eye.
Let’s begin today with the argument that we are in a long-term “secular” bull market regime and look at a few stats. There have been four secular bull periods dating back to 1921 (1921-1929, 1942-1951, 1982-2000 and 2009-present). Within those four secular bull market periods, there have been eight short-term “cyclical” bear market periods.
The median decline in the Dow Jones Industrial Average was 19% and lasted on average 238 days. Through yesterday, February 11, 2016, the Dow is down 15.5%.
We had corrections of -18.6% (1920s); -23.2% and -16.3% (1940s); -15.6% and-36.1% and -21.2% (1980s) and the last one in 2011 of -16.8%. So the median decline of 19% is in no way a firm number. It gives us some footing.
But, of course, others might argue that we remain in a “secular” bear market regime. Ed Easterling at Crestmont Research does some outstanding work and believes that price-to-earnings ratios (P/E) have not come down to a level that would begin a new secular bull market period. He believes we remain in a secular bear market.
With that in mind, note that the median drop during secular bear markets has been -34% and lasted on average 521 days. (Source: Tim Hayes, Ned Davis Research, “Cyclical Bear in a Secular Bull – Close to Completion?” February 12, 2016.)
Put me in the “I’m not sure” camp. I can make arguments for both. If secular bull, we are almost near the end of the correction. If secular bear, not so fast. What I do believe is that valuations matter and, when they are high, risk is higher and when low, risk is less. Valuations are high today, debt is excessive and recession is probable. Structural reform seems politically impossible absent crisis and the collective confidence in the Fed appears to be waning.
The big current systemic risks I see are: 1) a sovereign debt crisis in Europe; 2) an EM currency-triggered debt default risk; and 3) a meaningful high-yield default wave. I’m particularly concerned with the growing belief that our central bankers are “pushing on a string,” the high debt-to-GDP ratios and a slowing global economy.
To me, recession is the key both across the globe and here in the U.S. I’ve been messaging that I believe recession is probable this year and if recession arrives, then throw the “correction is almost over” argument out the window and consider the fact that in recession, markets decline 40%, 50% and 60%.
As the Denver Broncos showed us in Super Bowl 50, defense wins championships. Equity market valuations are simply too high. Focus on defense.
Today, I share with you a great chart that shows the 10-year forward return statistics by quintile based on reported earnings to calculate median P/E (lowest valuations to highest valuations) and we include the market decline statistics in each of those categories. Not surprisingly, you’ll see that the best returns and lowest risk periods were when valuations were low and forward potential return high.
We’ll also take a quick look at what is working today and I also share a few high-level notes from a research piece I came across this week that highlighted ten charts showing the global economy is struggling. Ok, let’s jump in.
? If you are not signed up to receive my weekly On My Radar e-newsletter, you can subscribe here. ?
Included in this week’s On My Radar:
- What We See Working
- Ten Charts On Why The Global Economy Is Struggling
- Trade Signals – Trend Negative, Investor Sentiment S/T Bullish, Relative Strength Leaders (High Quality Bonds, Utilities and Gold)
What We See Working
The point I have been trying to make is that there are ways to invest that enable us all to build stronger, more resilient portfolios. When valuations reach a point that they become attractive again, and they will, then it will be time to overweight equities within portfolios. When they are expensively priced, like today (here), then underweight and hedge equity exposure.
Here is the math we did based on month-end median P/E data. First, we looked at five different P/E valuation quintiles (least expensive to most expensive) and then looked at what the subsequent 10-year annualized returns turned out to be. Second, we looked at the worst case drawdown (i.e. if your stock portfolio worth $100,000 declined to $60,000 before it moved higher again, your drawdown was $40,000 or -40%).

Pretty logical and straight forward. The hard part is setting a game plan for the period in which we find ourselves. In periods of excessive valuation, I favor underweighting equity exposure – say 30%. In periods of extreme undervaluation, I favor overweighting equity exposure – say to 70%. As you can see from the chart above, returns are much greater in quintile 1 and risk is reduced. The exact opposite is true in quintile 5.
So what do you do with the remaining exposure? Generally, fixed income plays an important role; however, today our starting yields are less than 2%. They were 16% when I started in the business in 1984. So we have to take that into consideration.
Other asset classes, such as managed futures, tactical, global macro, gold, MLPs and equity long/short, can help you fill out your total portfolio. And you can tilt your exposure based on your return and risk objectives. The overall idea is that if you are all in equities, expect forward 10-year returns perhaps similar to quintile 5 above and expect risk to be most extreme (drawdowns that may occur along the path to those low returns).
Alternatively, consider adding relative strength and other types of liquid alternative strategies that enable you to seek growth in a more defensive way. One such strategy is relative strength.
Understanding Tactical Relative Strength
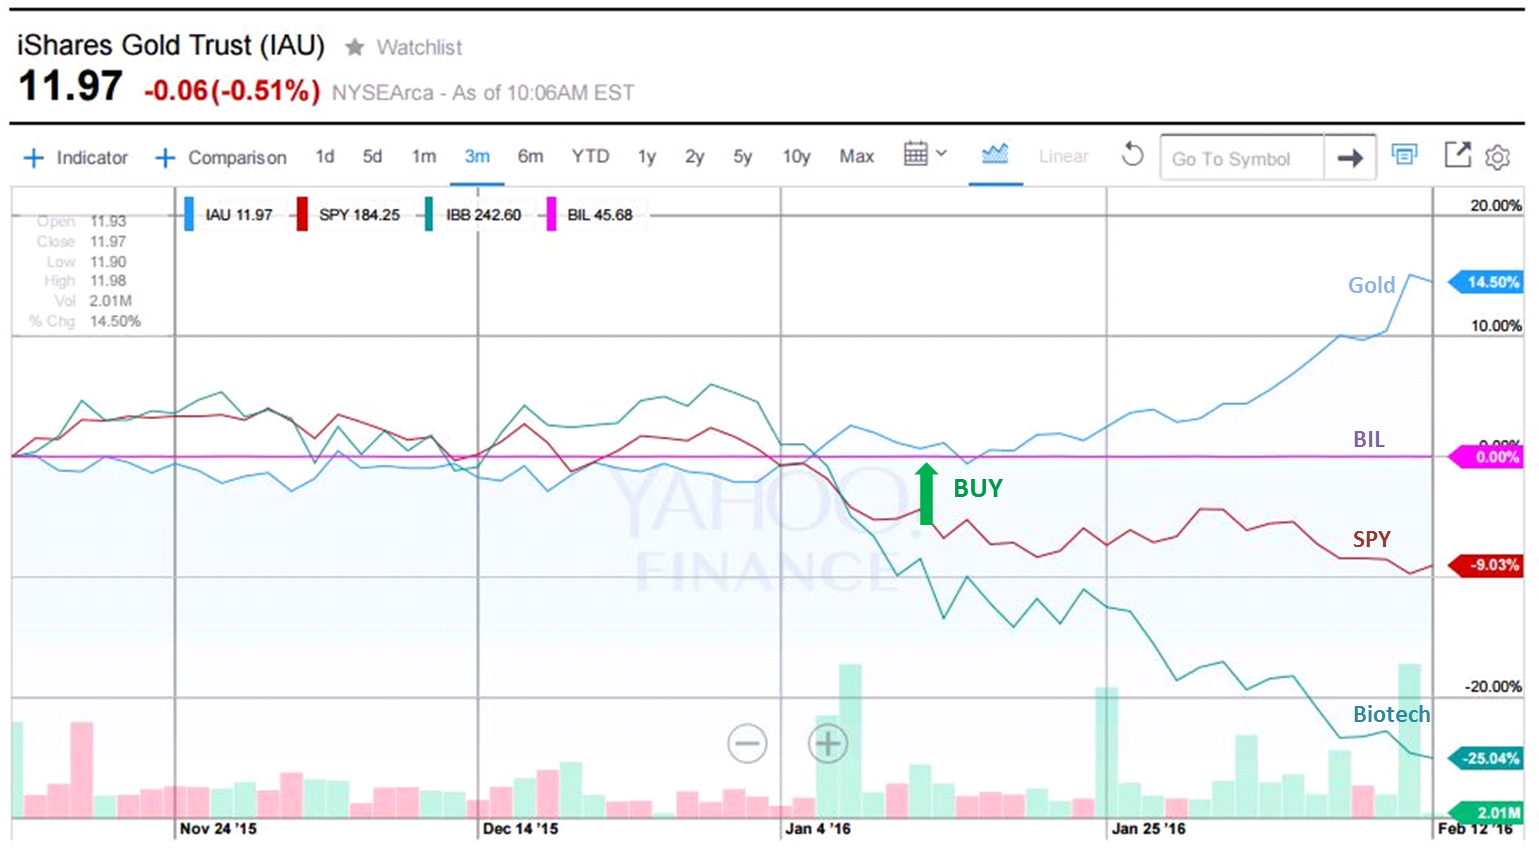
To get a sense of how it works, the following chart looks at four different assets we have in one of our CMG Opportunistic All Asset Strategy models. Note that there wasn’t too much difference in performance during the last quarter of 2015. The green buy arrow marks the point in which gold showed the strongest relative price leadership (based on how we measure RS) and that was when we positioned that model into IAU (iShares Gold Trust ETF). The point is that some assets are performing while others are not.
We believe such processes work well most of the time, but, of course, no strategy works well all of the time. The same is true for us. There will be periods when there is a lack of leadership and periods of some choppiness. Depending upon the number of asset classes within a relative strength strategy, there is the ability, systematically, to overweight bonds if bonds are performing well, add exposure to gold (etc) or pivot back to overweight equities.
I like the idea of overweighting and underweighting to equities based on the market’s current valuation and probable 10-year forward return. For a moderate investor seeking growth, today that may be 30% equities (hedged), 30% fixed income (tactically/flexibly managed) and 40% to liquid alternatives (relative strength, managed futures, global macro, gold, etc.). I place relative strength strategies in the liquid alternative bucket because of their flexible and potentially defensive nature. I define alternatives as anything other than traditional stock and bond buy-and-hold.
- Definition: Relative Strength can help identify asset class leadership. Relative strength is a measure of the price trend of a stock or other financial instrument compared to another stock, instrument or industry. It measures the price momentum of a handful of assets against each other to identify the leaders.
As an example: Within our relative strength strategy, 10 of our 11 models have us positioned in bonds (6), utilities (3) and gold (1). As you will see in the next chart, this has been a good place to be.
Here is what is going on with prices as of February 11, 2016:
Last November and December, we were fielding a number of calls regarding performance of diversified portfolios vs. the “market.” Diversified strategies and portfolios are not meant to outperform the stock market in the short-term, but alas our industry and media seems to message that each evening on the national news. “The market was up today.” We never hear that “bonds were up today.” So, is it any wonder, many individual investors compare what you do for them (design diversified portfolios to achieve a return and risk objective) against a basket of just 30 (DJIA) or 500 (S&P 500) of the largest U.S. stocks?
What a difference a few months make. The above chart helps put back into perspective the degree of risk that exists in owning equites. Nothing wrong with it if your client can stick it out. Unfortunately, behavioral history shows us most can’t.
Finally, relative strength has been extensively studied. There are hundreds of independent studies that attest to the validity of the price momentum variable. My point is that one should not look at such strategies as something new. These strategies may enable your portfolio to pivot more defensively or pivot more aggressively based on asset class leadership. Of course, past performance cannot guarantee future return. Risk simply exists in every type of investment (even CD’s and cash). It is the collection of various risks that I believe enable us to build more efficient portfolios. Here are a few studies to consider:
- The Profitability of Momentum Strategies – Chan, Lakonishok and Jegadeesh (1999)
- Do Industries Explain Momentum – Moskowitz (1999)
- Market Cycles and the Performance of Relative Strength Strategies – Stivers and Sun (2013)
- Mutual Fund Industry Selection and Persistence – Busse and Tong (2012)
- A Century of Evidence on Trend Following — AQR (2012)
- AQR cited the performance of “Time Series Momentum” and found the performance has been remarkably consistent over an extensive time horizon that includes the Great Depression, multiple recessions and expansions, multiple wars, stagflation, the Global Financial Crisis and periods of rising and falling interest rates.
- Jegadeesh and Titman (1993) found that past winners tend to outperform past losers over 3 to 12 months. Also see Jegadeesh and Titman (2001).
- Journal of Finance -Tobias Moskowitz and Mark Grinblatt (1999).
- Detail the positive persistence in stock returns (or momentum effect) over intermediate investment horizons (6 to 12 months) and explore various explanations for its existence.
- 212 Years of Price Momentum – Dr. Christopher Geczy and Mikhail Samonov
- One of the longest and most extensive studies on price momentum.
- Robert Shiller and Mr. Lars Peter Hansen won the 2013 Nobel Prize in Economics for their separate work on what drives asset prices.
With an eye towards portfolio diversification, I’ve just sent my final draft to my editorial team on a research paper I wrote, “The Total Portfolio Solution.” We are really excited about it and hope to share it with you soon.
As a quick aside, you may be getting a question from your client(s) who asks, “Why didn’t I beat the market?” We attempt to answer that question and several others in the links I share with you below. Feel free to use them. We hope you find them helpful in your work with your clients.
- When Beating the Market Isn’t the Point
- Correlation, Diversification and Investment Success
- The Merciless Math of Loss (this is about how compound interest works for you)
- Here is a link to our Advisor Blog page
- Here is a link to our Advisor Resource page
10 Charts on Why the Global Economy is Struggling
Several quotes (emphasis added) worth noting from Greg Schnell, CMT, is Senior Technical Analyst at StockCharts.com specializing in intermarket and commodities analysis.
In my observation, continuing the notion that a sector-wide, collapsing energy industry is bullish, is irresponsible at best. For all the environmentalists, I do see distributed power as a road to the future. Getting there so fast that it spins the world into a global depression doesn’t appear to be the best path. Global container freight, dry freight, steel, valve and actuator manufacturers, process control equipment, hotels, restaurants, oilfield supply, drilling, helicopters, telecommunications, heavy equipment, highway tractors, trailer manufacturers, specialty equipment manufacturers, and even clothing are all impacted to name but a few.
The wind and solar companies have to compete at these new levels and many are failing to. In the finance area, the debt coming due is setting up global repercussions. Goldman Sachs, Morgan Stanley and the major banks worldwide are all suddenly reeling at the size of the monster ahead. The worst part is other industries are falling in sales and their debt ratios are becoming outsized with a declining business.
The fact that the globe is slowing might be a story told by the complete collapse of the raw materials and energy sector. Using Commodities as a barometer of actual demand is not always perfect but this epic scale is important.
For every job removed, politicians will need an equal and more economically powerful job to replace it. The energy industry is one of the top paying industries because of the remote locations to access the resource.
There have been so many academics, economists, journalists and TV commentators touting the $10 Billion benefit of low oil to the American consumer. One mega-project in the industry is $20 Billion in direct spend, and over 150 projects of varying sizes have been stopped worldwide. Financially related investment communities worldwide that continue to say the banks are the only systemically important sector are surprisingly naive. It might be time to roll through the charts and send some facts into the conversation.
Following are two of the ten charts:
I’ve long kept my eye on the Baltic Dry Index to get a sense for how the global economy is doing. Baltic Dry Index is a shipping and trade index created by the London-based Baltic Exchange that measures changes in the cost to transport raw materials such as metals, grains and fossil fuels by sea. As you can see, it is not looking good. The index is at an all-time low (index dates back to January 2003). This isn’t good.
Here is the link to all 10 charts and Greg’s commentary. Well worth the read.
Trade Signals – Trend Negative, Investor Sentiment S/T Bullish, Relative Strength Leaders (High Quality Bonds, Utilities and Gold)
By Steve Blumenthal
Posted Wednesday February 10, 2016
The trend remains negative for equities and high yield. We continue to see relative strength leadership in utilities, fixed income, tax-free fixed income and gold. Investor sentiment remains extremely pessimistic. This supports a short-term oversold bounce in equities.
The Global Recession Watch indicator continues to show a probable global recession has started. See my U.S. Recession Signals Intensify article in Forbes here.
Included in this week’s Trade Signals:
Equity Trade Signals:
- CMG Ned Davis Research (NDR) Large Cap Momentum Index: Sell Signal – Bearish for Equities
- Long-term Trend (13/34-Week EMA) on the S&P 500®Index: Sell Signal — Bearish for Equities
- Volume Demand is greater than Volume Supply: Sell Signal – Bearish for Equities
- NDR Big Mo: See note below (active signal: sell signal on 1-15-16).
Investor Sentiment Indicators:
- NDR Crowd Sentiment Poll: Extreme Pessimism (short-term Bullish for Equities)
- Daily Trading Sentiment Composite: Extreme Pessimism (short-term Bullish for Equities)
Fixed Income Trade Signals:
- The Zweig Bond Model: Sell Signal
- High Yield Model: Sell Signal
Economic Indicators:
- Don’t Fight the Tape or the Fed: Indicator Reading = 0 (Neutral for Equities)
- Global Recession Watch Indicator – High Global Recession Risk
- S. Recession Watch Indicator – Low U.S. Recession Risk (Though Nearing a Recession Signal)
Tactical — CMG Opportunistic All Asset Strategy:
- Relative Strength Leadership Trends: Utilities, Fixed Income, Muni Bonds and Gold are showing the strongest relative strength:
Click here for the link to the full Trade Signals (updated charts and commentary).
Personal note
Secular bull or secular bear – frankly, I don’t know and don’t care. Recession is the trump card (maybe I shouldn’t have used that word – as I’m sure his thinks he is the Trump card). So let’s keep an eye on the recession probability models. A number of strategies are doing well. Call us or email us at [email protected] if you need a few ideas.
Naples, Florida is up next on February 29. I’m attending the CBOE Risk Management Conference. We do a lot of hedging within one of our equity funds and I’m looking forward to a spirited few days. We trade ETF-based options and have experienced first-hand the growth in liquidity, trading volume and the tightening in bid/ask spreads. I’m looking forward to learning more.
Dallas follows in the first week of March for a mutual fund gathering of key platform decision-makers. I will travel to Indianapolis in mid-March for an advisor’s client event and to San Francisco on March 23 for several meetings and my fingers are crossed for a few days at Snowbird with Susan (now a snowboarder – kind of cool), Brianna and our five boys.
Best wishes to you and your family!
? If you are not signed up to receive my weekly On My Radar e-newsletter, you can subscribe here. ?
With kind regards,
Steve
Stephen B. Blumenthal
Chairman & CEO
CMG Capital Management Group, Inc.
Stephen Blumenthal founded CMG Capital Management Group in 1992 and serves today as its Chairman and CEO. Steve authors a free weekly e-letter entitled, On My Radar. The letter is designed to bring clarity on the economy, interest rates, valuations and market trend and what that all means in regards to investment opportunities and portfolio positioning. Click here to receive his free weekly e-letter.
Social Media Links:
CMG is committed to setting a high standard for ETF strategists. And we’re passionate about educating advisors and investors about tactical investing. We launched CMG AdvisorCentral a year ago to share our knowledge of tactical investing and managing a successful advisory practice.
You can sign up for weekly updates to AdvisorCentral here. If you’re looking for the CMG white paper, “Understanding Tactical Investment Strategies,” you can find that here.
AdvisorCentral is being updated with new educational resources we look forward to sharing with you. You can always connect with CMG on Twitter at@askcmg and follow our LinkedIn Showcase page devoted to tactical investing.
A Note on Investment Process:
From an investment management perspective, I’ve followed, managed and written about trend following and investor sentiment for many years. I find that reviewing various sentiment, trend and other historically valuable rules-based indicators each week helps me to stay balanced and disciplined in allocating to the various risk sets that are included within a broadly diversified total portfolio solution.
My objective is to position in line with the equity and fixed income market’s primary trends. I believe risk management is paramount in a long-term investment process. When to hedge, when to become more aggressive, etc.
Trade Signals History:
Trade Signals started after a colleague asked me if I could share my thoughts (Trade Signals) with him. A number of years ago, I found that putting pen to paper has really helped me in my investment management process and I hope that this research is of value to you in your investment process.
Following are several links to learn more about the use of options:
For hedging, I favor a collared option approach (writing out-of-the-money covered calls and buying out-of-the-money put options) as a relatively inexpensive way to risk protect your long-term focused equity portfolio exposure. Also, consider buying deep out-of-the-money put options for risk protection.
Please note the comments at the bottom of Trade Signals discussing a collared option strategy to hedge equity exposure using investor sentiment extremes is a guide to entry and exit. Go to www.CBOE.com to learn more. Hire an experienced advisor to help you. Never write naked option positions. We do not offer options strategies at CMG.
Several other links:


