Technical Analysis of the Corn Market
Corn Market 2015
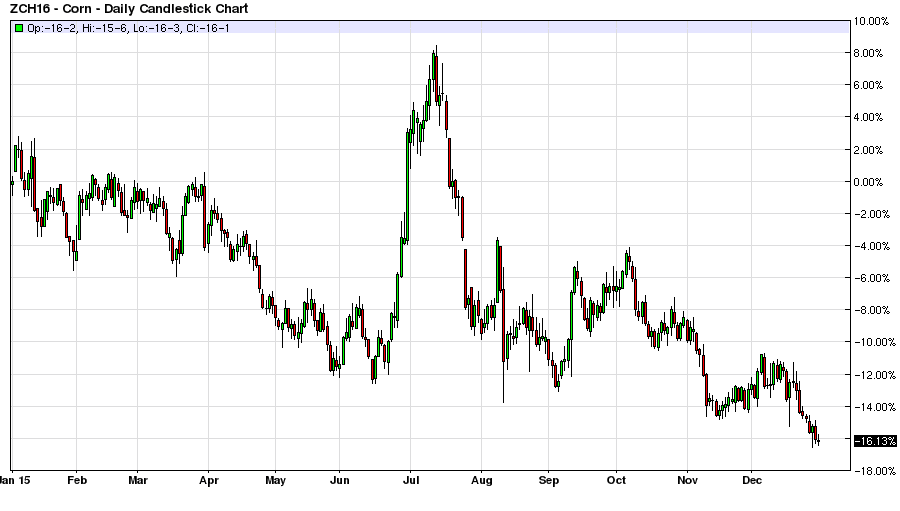
I have been watching corn prices lately as they are getting low enough to at least pique my interest into looking at a market that usually just gets bypassed with the rest of my agricultural futures prices tab on my trading platform, more out of habit than having anything in particular against the agricultural markets. The March 2016 Futures contract was down about 16% in 2015 along with most of the commodity space on fund outflows, a weak China, and a strong dollar.
Economics of Agricultural Space
This goes against my intuition regarding long-term supply and demand drivers in the global economy. For example, the world population continues to grow, good farming land with proper soil management is a finite resource, and the world is going to need more food in the future. The Corn market looks like a buy over a five year time frame, unless the Midwest lobby loses big in Washington politics and the corn ethanol production market completely goes by the wayside, this probably would result in a drop before another spike as farmers readjust crop sizes to the new economics. But all else being equal I expect the corn market to go on another one of those massive runs higher sometime over the next five years given its recent history from a trading standpoint, and the broader economic drivers for the commodity over time.
Market Timing
But from a trading standpoint what I really want to know is are there any good trading setups because although I try to eat relatively healthy and exercise when I can for practical purposes I could be dead in five years. Maybe Warren Buffet can wait for 5 years for his investments to pay off but most of the street gets paid on an annual and quarterly basis. If a fund has a bad quarter, redemptions go up, and their assets under management go down. This is not good for fund managers as their compensation goes down from a lower management fee base, and obviously if they are having a bad quarter their percentage of profits number is headed in the wrong direction.

The bottom line is that most people have to get the timing right in an investment or trade, at least within the same calendar year. So what do the technical look like in the corn market? The theory is that everything that is going on with the fundamentals of the corn market are reflected in the charts, along with the technical and psychological drivers of the market. The idea is that the technicals will tell me when to get back into the corn market at least for a nice trading setup, they will tell me when something regarding market sentiment is changing at least from a fund flows perspective.

Technicals
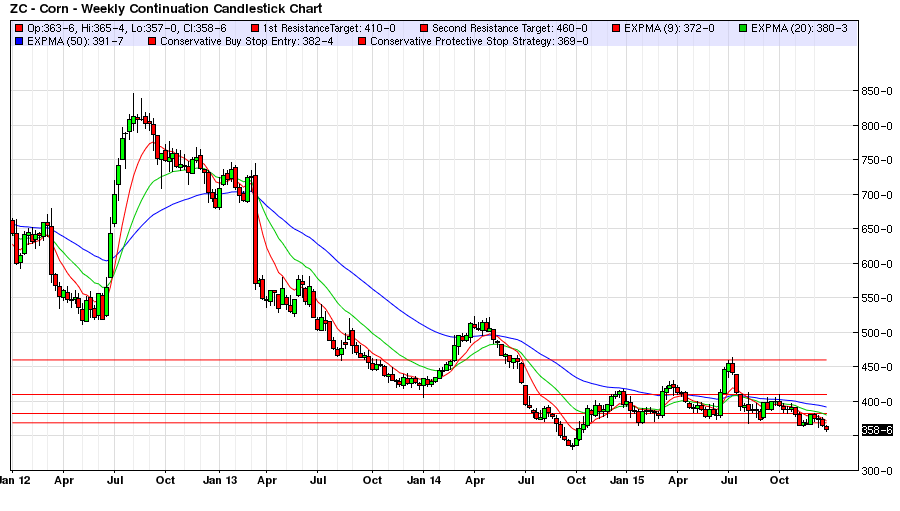
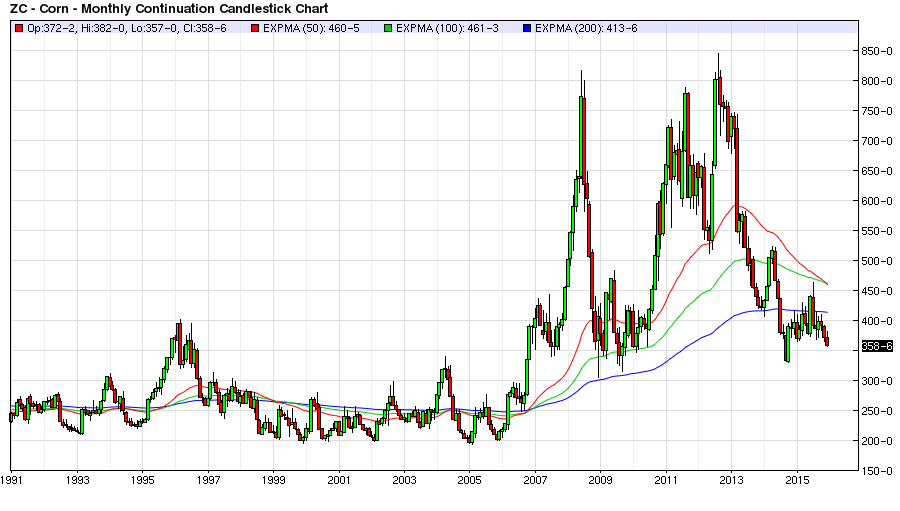
Therefore in looking at the two year futures chart I have picked out the 410.00 cents per bushel area where I start to get interested in the corn market. We are currently at the 358.00 cents per bushel area, and I am not looking for a short in this market. However, from a trader`s perspective there is a two year trend line going from the 510.00 cents per bushel area to the current price area of 358.00 cents per bushel area. If price breaks above this trend line around 370.00 cents per bushel, this could be a good buy stop entry with a relatively tight protective stop in the area of 364.00 cents per bushel to 357.00 cents per bushel depending upon your trading style.

Overhead Resistance
The first target on this entry would be a break of the 396.60 cents per bushel high in late October of this year on the six month chart to test overhead resistance at the 410.00 cents per bushel high last hit October 7th of 2015. The Reward to Risk profile is 6.67 Units of Reward to 1 Units of Risk with the tighter stop around 364.00 cents per bushel , and 3 to 1 with the wider protective stop at 357.00 cents per bushel. I would watch price very carefully because what I am in this trade for is a break of the 410.00 cents per bushel overhead resistance area with the next profit target around 464.00 cents per bushel last established in July of 2015.
As long as you have a winning trade, why not let the market tell you when it is done going in your direction? Has the trade broken any key technical levels of support? These markets are a lot bigger than one would think, and once the fund flows start coming into a market, a trader or investor needs to take this into account, as often the results are binary. For example the market is either going to go your direction, and if it does expand your profit target more because it is going to move a good way on changing capital structures. Or alternatively the trade is a non-starter, and a tight stop will tell you pretty early that your timing is just not right on the trade for a relatively cheap price.
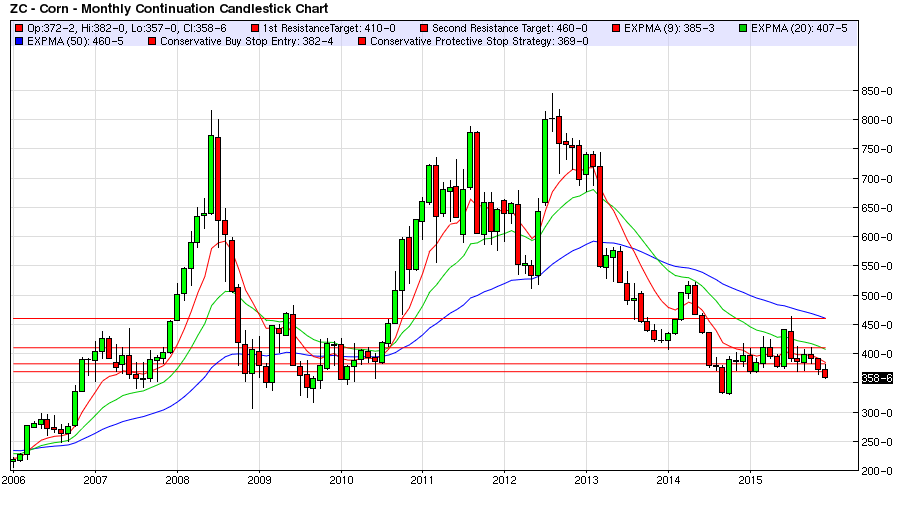
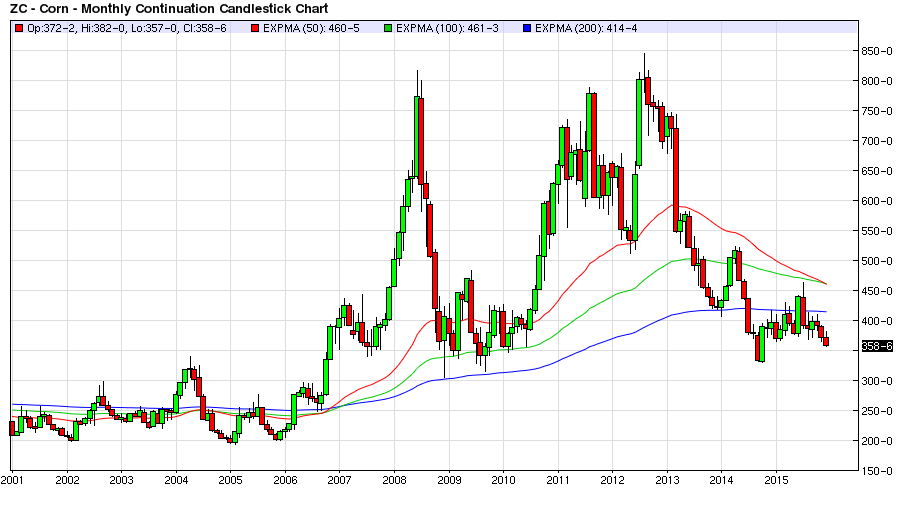
The next overhead resistance level in the corn market is around 510.00 cents per bushel last established in late April of 2014. The five year high in the corn market was established on August 6th 2012 at around 845.00 cents per bushel. The 10-Year Corn Futures chart basically has a double top on it around the 800.00 cents per bushel area, which give or take the short squeeze effect, is good enough for a price barometer where the market starts to entertain that it is overvalued, and lots of shorts and hedges enter the market for good.
Long Term Support
The fifteen year chart has the 200.00 to 250.00 cents per bushel area as longer term support for those wanting to look at the trade on the short side. With the 25-Year chart reinforcing the idea that the 200.00 cents per bushel area represents solid long term support for corn futures. The problem is that a lot of this history is before modern electronic markets really took off and became global marketplaces for investors. And when inflation effects are factored into the equation, on an inflation adjusted basis corn is probably at or near a 25 year low right now at the current price.
The Patient Investor
And for those investors with a five year time frame and no pressure from outside investors, given the nice bull moves of the last 10 years in the corn market, it makes sense to try and anticipate the next large move in this agricultural staple. Therefore, if you want to get into the corn market now and wait for the move, one needs an instrument or asset where they can stay in the trade and not be liquidated, depreciated beyond reasonable time decay, and get the best full value of the move if it transpires.
Corn Futures Curve
For example, the December 2019 Corn Futures contract only has 9 contracts of open interest at the close today with a prior close at 417.40 cents per bushel with the last actual trading volume today in the December 2018 futures contract with a price of 410.00 cents per bushel with a lofty 3 contracts trading hands. Most of the open interest in the corn futures market only goes out 2 years to the December 2017 futures contract which is trading around the 400.00 cents per bushel area at the close of this year.
For those who don`t like to roll over futures contracts the December 2017 contract probably isn`t the worst way to play it since most investors may not want to get into the complexities of buying up farm land, and are not going to have access to the swaps market for practical purposes. Thus, we will see if 2016 brings better fortune for the corn market than the past 3 years where corn futures are down nearly 50% over this timeframe.


