
Market volatility has always been with us. But this market has been different since 1995 when Hedge Funds began to exert price dominance. Prices are set by the dominant market psychology. Since 1995 we have seen wide variations of the SP500 vs. SP500 Intrinsic Value Index ($SPY)-see chart-which was designed to track the process Value Investors deploy in their thinking. Both of our recent market bubbles, the ‘Internet Bubble’ and the ‘Commodity-Housing Bubble’ also known as the ‘Sub-Prime Housing Bubble’ had significant deviations from the past relationship with the SP500 Intrinsic Value Index. These bubbles were due to Hedge Fund Momentum Investors.

Do you remember the ‘Peak Oil’? ($OIL)($USO) Wikipedia has a good history of the thinking which fed market psychology in 2007, https://en.wikipedia.org/wiki/Peak_oil. Net/net the often repeated belief was that the world was running out of oil and China would buy it all with its insatiable appetite. The US standard of living as we knew it was over! Did anyone notice that the concept of ‘Peak Oil’ has disappeared? There is a lesson to be learned here.
The Hedge Fund managers apply multiple approaches. The approach which has tended to overwhelm the others has been Momentum Investing. Momentum Investing is what it sounds like. Somewhat like the momentum concept in physics which is equal to mass times velocity(momentum = mass x velocity), investment market momentum is price times volume(investment momentum = share price x share trading volume). There are a number of Hedge Fund managers who do consider themselves ‘Rocket Scientists’. This investment approach is exercised by massive computer power and applied mathematical algorithms. While many of these managers indicate that they are tracking economics and valuations, what they are really doing is tracking market psychology. If they see psychology causing prices to shift with an increase in trading volume, they jump into the trend with increasing amounts of capital. This drives the trend further in the direction the Momentum Investor identified. This continues gathering more and more capital till it stops! Then the Momentum Investor looks to find the next big trend. As Hedge Fund Momentum Investor capital builds, roughly ~$3trillion today, they require larger more liquid markets. They often need to switch direction quickly to capture a trend before another manager does this. Each manager is attempting to out-guess competitors, to get in first and out first. Market volatility has increased substantially as a result as seen by the change in SP500 vs. SP500 Intrinsic Value Index deviation post 1995 as compared to that pre-1995
The concept of ‘Peak Oil’ combined with stories of China developing massive energy demand and strong Chinese importation of copper and other materials in a government supported Sub-Prime lending agenda were factors driving markets to the 2007 peak. It should be fairly easy to see impact on prices in the
[drizzle]The Chinese government had made it clear that it intended in its Command Economy approach to build many cities and factories in a bold move to ratchet its GDP higher and improve the wealth of its citizens. The potential for investment opportunity caused many to overly rely on stock price trends rather than on economic trends. Our ‘Commodity-Housing Bubble’ of 2007 was the result. In part Chinese growth perceptions after the recession of 12/2007-6/2009 kept oil prices high. This expectation was supported by the perception that the US credit efforts would create hyper-inflation and many Hedge Funds bet that the US Dollar would fall relative to global currencies. These expectations were spoken often in the media 2010-2014. Some managers who had taken the correct side of the Sub-Prime correction spoke of their purchasing of almond farms in California and farmland in Illinois as they believed hat food producing assets would be some of the only assets of value in the coming hyper-inflation they expected with Fed easing actions. So strong was this belief that rental rates in Illinois farm land fell from 6% to 3%. That major Hedge Fund managers were thinking this way is easily documented in hundreds of articles and interviews during the period. The problem was that none of what so many expected happened!FXI-iShare s China Large Cap vs. WTI Oil Price chart
What did occur which many did not expect was a rise in the US Dollar as Russia invaded the Ukraine to take Crimea early 2014 and then begin actions to take control of eastern Ukraine. On the Russian action, funds shifted into US Dollar denominated assets causing the US Dollar to strengthen. Suddenly, the bet for hyper-inflation was no longer tenable and those who had made this bet had to reverse as they saw it prove to be very, very unprofitable. As a result the US Dollar, which so many had shorted, saw a strong rise against all currencies without an economic basis. Likewise, yields on the 10yr Treasury fell as those who were short had to cover and oil bought as a historic inflation bet had to be sold. This was accelerated once the perception of catastrophic excess production became the theme. Versus the Euro, the US Dollar rose from a ratio of $1.35/Euro early 2014 to the current $1.05/Euro today, 10yr Treasury rates fell from ~3% in Dec 2013 to 1.65% in early 2015 while oil fell from $105bbl in mid-2014 to the prices we see today as shown in the chart. Many only see economic disaster looming in the months ahead. (In an earlier note, I discussed that the strength in the US Dollar did not have economic support. I indicated that this was a Hedge Fund trade which should eventually normalize back to its economic trend.)
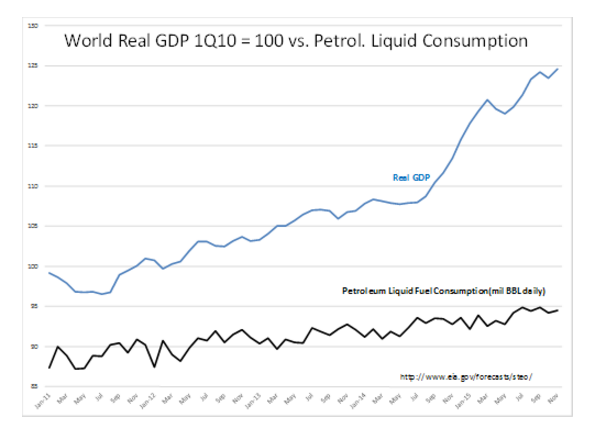
No disaster in fact appears on our economic horizon. The World Real GDP 1Q10 = 100 vs. Petrol. Liquid Consumption chart below agrees with the many economic measures available that the global economy continues to expand and consume petroleum as the primary energy source for transportation. There is not enough space here to repeat the many individual measures which reveal decent uptrends. With the recent rise in World GDP since late 2014, higher petroleum consumption is to be expected. History should have taught us that the current forecasts of devastating prices for oil producers lasting for years have never made sense. Producers slow production when it is uneconomical. It simply takes some time. Much of the talk today comes from Momentum Investors ‘talking their book’ just as we saw during ‘Peak Oil’.
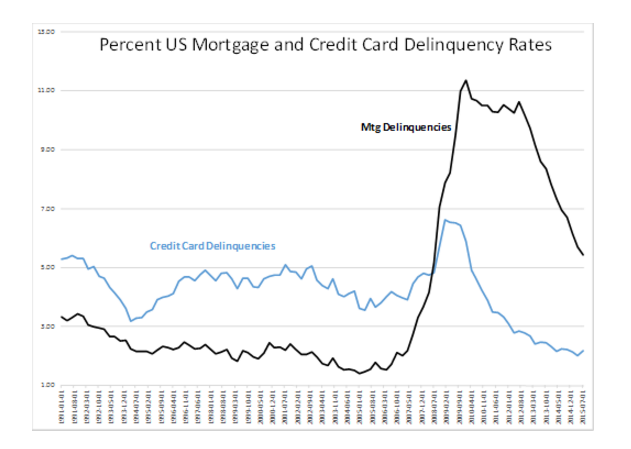
Lending to individuals ,which is the primary driver of businesses globally, continues to run at low levels. Both of the debt categories commonly used to measure the financial distress of individuals shown in Percent US Mortgage and Credit Card Delinquency Rates chart are in decline. Credit card debt is at the lowest delinquency rate ever measured while mortgage delinquency rate continues its decline. Economic corrections have never occurred when individuals have managed their credit in such a conservative manner. Those who forecast a ‘Black Swan’ do not have an appreciation of the basis for global commerce. That basis is individual consumption!
The basis for economic activity and global expansion is the financial health of individual consumers. If we have not spent to excess, as we have not in the current environment, then we have plenty of running room for the current expansion.
The lesson we should learn is that economics eventually wins over market psychology and the many assertions of Momentum Investors. Patience and attention to economics is the only approach which rules volatility.
[/drizzle]


