
Leveraging And Deleveraging: Beauty Or The Beast? by Steve Blumenthal, Capital Management Group
“The economy is like a machine. At the most fundamental level it is a relatively simple machine. But many people don’t understand it – or they don’t agree on how it works – and this has led to a lot of needless economic suffering…
Seeing the economy and the markets through this ”transactions-based” perspective rather than seeing it through the traditional economic perspective has made all the difference in the world to my understanding of what is going on and what is likely to happen.
It lets me see what is actually happening and why it’s happening in much more granular ways than the traditional way of looking at things.
Because money and credit, and through them demand, are easier to create (or stop creating) than the production of goods and services and investment assets, we have economic and price cycles.
This different way of looking at the economy and markets has allowed us to understand and anticipate economic booms and busts that others using more traditional approaches have missed.”
-Ray Dalio
Susan handed me a cup of coffee this morning and asked, “What are your writing about today? Interest rates?” She was really poking fun at me. How do we simplify this stuff in a way that makes sense? I said, “well kind of” adding that this week it is about “beautiful deleveraging or ugly deleveraging.” “I’m not sure I know what you mean”, she said.
So today I’m writing to Susan and through her hopefully I can paint a picture of the deleveraging forces that are underway and how they impact all of us. My hope is that I can keep it simple enough and present in a way that makes sense to the layperson so that you can share some of this with your family and, if you are an advisor, with your client.
We all want to make the great call, nail the timing and make money. I believe Susan and most individual investors for that matter expect us to get it right – all the time. And that’s the rub. Not going to happen. Perfect is impossible in this game of investment risk but I think we can get fairly close on directional trends. And we can position to take advantage of opportunities and use viable tools to protect us against significant loss. Understanding the larger forces in play and where we sit at any point in time within an economic cycle can serve us well. So where are we today?
We are at the beginning of a debt deleveraging cycle. I wrote in OMR a few weeks ago about three big risks I see: a European sovereign debt crisis, an emerging debt crisis and a coming high-yield default crisis. I went into additional detail in a piece I wrote today for Forbes titled, How To Profit From Runaway Debt And The Next Global Recession. (Click here to view the piece).
But the debt mess is much broader than the above. It is global and it will be unwound. I believe the most important question today is: Will the deleveraging be a beautiful deleveraging or an ugly deleveraging? This may be the most important factor, at this point in time, for us to understand and get right.
“Susan,” I said, “do you remember the ‘no interest’ credit card offerings and all the mortgage refinancing’s that took place when money was easy?” That credit was money used to drive and inflate the economy. That is a leveraging up cycle. Borrow from the future and spend today. You can get a sense of how that drove economic expansion. But leveraging cycles reach a point where many borrowers hit an end point. Spending slows for them and, if too many borrowers reach that point around the same time, the economy slows for all of us.
She remembered when my sister had to declare bankruptcy. My sister was earning $50,000 per year and was able to borrow from her home and borrow on credit cards enabling her to spend $70,000 per year. Credit card debt reached $75,000, at some point soon after the gig was up. Like my sister, when an economy collectively reaches this tipping point it begins a deleveraging cycle. Absent a meaningful increase in wages, spending slows and the pay down of debt begins. Thus, deleveraging. When the global economy collectively reaches this point at the same time, economic activity slows, global trade slows and deleveraging takes hold. That is where we are today.
Deleveraging, deflation, recession, inflation or depression? How the current cycle plays out depends on the amount of debt (how large) and how governments (through tax policies, spending and the types of spending) and monetary authorities (central banks, printing, security purchases), investors and individuals behave.
The seminal question is: will it be beautiful or ugly? Beauty or beast?
It has been an interesting week. Mario Draghi disappoints (offering not enough QE – the euro rallies) and Janet Yellen signals a December lift-off (though just a tiny little move – can’t risk an all-out global capital flight to the U.S. dollar). The fundamental problem is unmanageable debt (see the debt-to-GDP charts below).
Without getting too deep into the weeds, you can begin to see the depth of complexity that exists in order to soft land this puppy. Currency games, central bankers, politicians, taxes, trade tariffs, negative interest rates, QE, global capital flows. Each country attempting, in its own self-interest, to land its debt-burdened plane in bumping conditions. How do I explain this to Susan, my family, my team and my friends? It is more like a plane coming in hot for a landing with two engines out: will the landing be beautiful or ugly? It’s the multi-trillion dollar question. My sister’s plane landed in some form of bankruptcy. It was a bit bumpy but she’s in much better shape now.
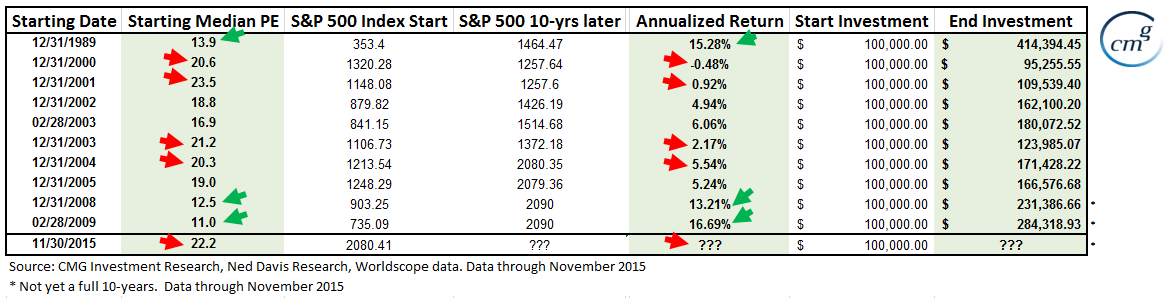
You’ll also find the most recent valuation metrics. With a Median-PE of 22.2 on November 30, 2015, the market is richly priced. Here is a quick look at other periods of high PE and what the corresponding annualized returns were 10-years later (note the red arrows). The green arrows show the low PEs. Green light, red light. You get the picture.
I hope you find this information helpful in your work. Please let me know if you have any questions. Okay, grab a cup of coffee and jump in.
Included in this week’s On My Radar:
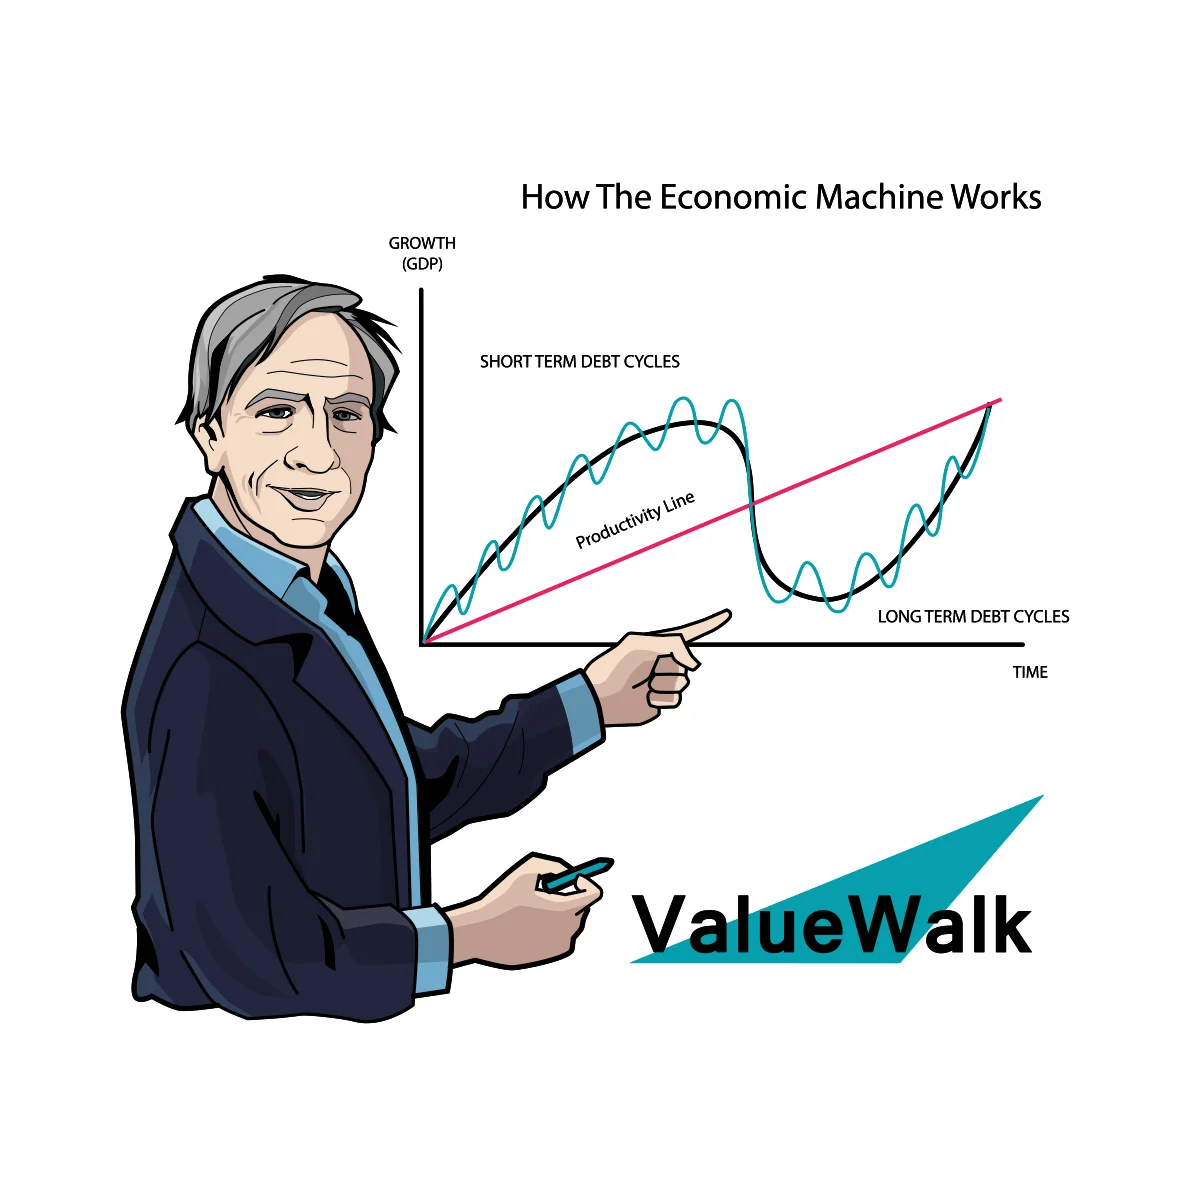
- How The Economic Machine Works – Leveraging’s and Deleveraging’s (Ray Dalio)
- Debt-to-GDP by Country
- A Quick Look at the Most Recent Valuation Metrics – Equities Remain Richly Priced
- Stuffing Balls, Slippers and the Nana Bag
- Trade Signals – Seasonal Tendencies, Trend Better, Don’t Fight the Tape or the Fed is Now Neutral
How The Economic Machine Works – Leveraging’s and Deleveraging’s (Ray Dalio)
In past posts, I’ve shared with you a link to a relatively short animation of How The Economic Machine Works. You can view it on YouTube here. I had my daughter watch it (with great feedback).
Today, I provide a link to a 305-page PDF that goes into great detail (Click here to view piece). I know – it’s long. Who has time read and digest it all? I loved it and am making it required reading for all my kids. Frankly, this is research that, I believe, should be taught in every business school or more broadly to every high school student. You’ve got to understand how the engine works and where we are at any point in an economic cycle.
The basics are about money and credit and that we have expansionary “leveraging” periods followed at some point in time by “deleveraging” periods. That is at a point in time that lenders are no longer willing to provide more credit for fear they will not be paid back. Some cycles are recessionary (moderate debt corrections and contraction) and some are depressionary (large corrections and contraction).
When things get too bad, governments step in as the lender (providers of capital) of last resort. Selected quotes from the piece follow, “In a credit-based economy, the ability to spend is an extension of one’s ability to borrow. For lending/borrowing to occur, lenders have to believe that (a) they will get paid back an amount of money that is greater than inflation and (b) they will be able to convert their debt into money. In deleveragings, lenders justifiably worry that these things will not happen.
Unlike in recessions, when cutting interest rates and creating more money can rectify this imbalance, in deleveragings, monetary policy is ineffective in creating credit. In other words, in recessions (when monetary policy is effective), the imbalance between the amount of money and the need for it to service debt can be rectified by cutting interest rates enough to (1) ease debt service burdens, (2) stimulate economic activity because monthly debt service payments are high relative to incomes and (3) produce a positive wealth effect.
However, in deleveragings, this can’t happen. In deflationary depressions/deleveragings, monetary policy is typically ineffective in creating credit because interest rates hit 0% and can’t be lowered further, so other, less effective ways of increasing money are followed (such as negative interest rates or QE).
Credit growth is difficult to stimulate because borrowers remain over-indebted, making sensible lending impossible. In inflationary deleveragings, monetary policy is ineffective in creating credit because increased money growth goes into other currencies and inflation-hedge assets because investors fear that their lending will be paid back with money of depreciated value.
In order to try to alleviate this fundamental imbalance, governments inevitably (a) create initiatives to encourage credit creation, (b) ease the rules that require debtors to come up with money to service their debts (i.e., create forbearance) and, most importantly, (c) print and spend money to buy goods, services and financial assets.
Evidence of such periods are pretty clear as we see in the next three charts: The printing of and buying financial assets by central banks shows up in central banks’ balance sheets expanding and the increased spending by central governments shows up in budget deficits exploding.


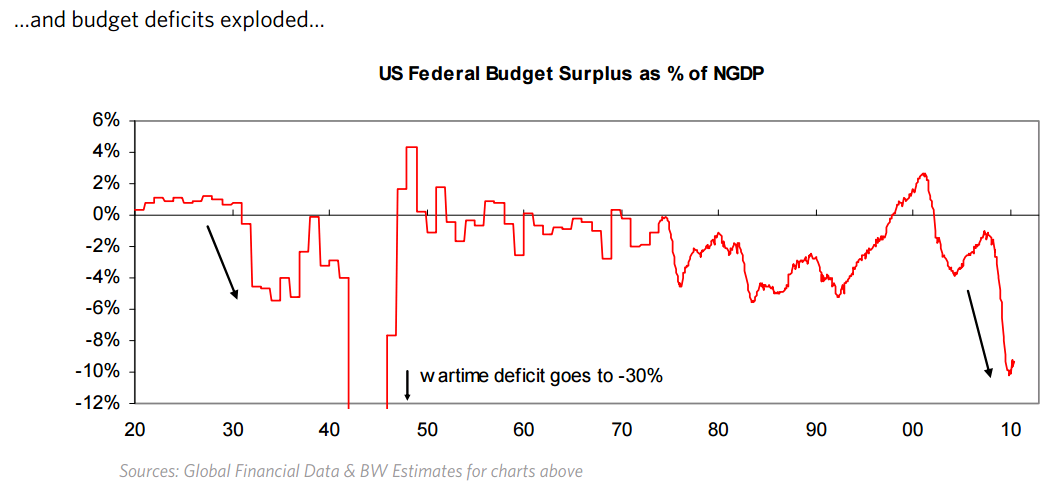
You can tell deleveragings by these three things occurring together, which does not happen at other times.
Typically, though not necessarily, these moves come in progressively larger dosages as initial dosages of these sorts fail to rectify the imbalance and reverse the deleveraging process. (SB: THIS IS WHAT WE ARE WITNESSING TODAY.)
However, these dosages do typically cause temporary periods of relief that are manifest in bear market rallies in financial assets and increased economic activity. For example, in the Great Depression, there were six big rallies in the stock market (of between 21% and 48%) in a bear market that declined 89%, with all of these rallies triggered by these sorts of increasingly strong dosages of government actions that were intended to reduce the fundamental imbalance.
That is because a return to an environment of normal capital formation and normal economic activity can occur only by eliminating this fundamental imbalance so that capable providers of capital (i.e., investors/lenders) willingly choose to give money to capable recipients of capital (borrowers and sellers of equity) in exchange for believable claims that they will get back an amount of money that is worth more than they gave.
Eventually there is enough “printing of money” or debt monetization to negate the deflationary forces of both debt reduction and austerity. When a good balance of debt reduction, austerity, and “printing/monetizing” occurs, debt burdens can fall relative to incomes with positive economic growth. In the U.S. deleveraging of the 1930s, this occurred from 1933 to 1937.
Some people mistakenly think that the depression problem is just psychological: that scared investors move their money from riskier investments to safer ones (e.g., from stocks and high-yield lending to government cash), and that problems can be rectified by coaxing them to move their money back into riskier investments. This is wrong for two reasons. First, contrary to popular thinking, the deleveraging dynamic is not primarily psychologically driven. It is primarily driven by the supply and demand of and relationships between credit, money and goods and services.
One of the greatest powers governments have is the creation of money and credit, which they exert by determining their countries’ monetary systems and by controlling the levers that increase and decrease the supply of money and credit.”
In short summary, we need to be watching for the elements that might produce a beautiful deleveraging or an ugly deleveraging. The game is ongoing and no clear winner has appeared. Step up and place your bets.
Dalio breaks deleveragings into three categories:
1) “ugly deflationary deleveragings” (which occurred before enough money was “printed” and deflationary contractions existed and when nominal interest rates were above nominal growth rates)
2) “beautiful deleveragings” (those in which enough “printing” occurred to balance the deflationary forces of debt reduction and austerity in a manner in which there is positive growth, a falling debt/income ratio and nominal GDP growth above nominal interest rates)
3) “ugly inflationary deleveragings” (in which the “printing” is large relative to the deflationary forces and nominal growth through monetary inflation and interest rates are in a self-reinforcing upward spiral)
A lot of people worry about inflation being the outcome of all the money-printing. That is not a certainty. In a beautiful deleveraging, the inflationary forces of money creation is off-set by the deflationary forces of debt reduction.
My two cents is that a beautiful deleveraging is possible but not without great risk. Picture that airplane coming in short of fuel with two engines out. Our collective bet is that a combination of government action (i.e., tax reduction, productive spending such as a highway and infrastructure rebuild bill, a restructure of entitlement programs) and central bank policy coupled with a healthy default cycle and time will reset the system enabling it to begin a new leveraging cycle. A hard landing is possible, so is a crash. It takes a lot of cooperation from people with competing interests (politicians, central bankers, bankers, corporations and investors).
This all gets me back and centered again on risk and forward probable returns. My Susan wants to know “what and when” and expects me to keep us positioned properly. Personally, I’m broadly diversified in our various strategies and I’ve recently taken a few aggressive bets buying put options on several ETFs. Essentially, along the lines of the big three risks I see. While I have high conviction, we are dealing with many moving parts. I’ll be doing my best to adjust to the evidence as time moves forward.
It is important to get a feel for the severity of the debt so let’s go there next. Following is a quick look at some of the country-by-country debt-to-GDP data followed by a few charts showing the most recent market valuation metrics. As my mentor Jim Ruff likes to say, “if you can’t measure it, you can’t manage it.”
? If you are not signed up to receive my weekly On My Radar e-newsletter, you can subscribe here. ?
Debt-to-GDP by Country
When you look at the next chart, note that historically countries have gotten into economic trouble when their debt-to-GDP ratio exceeded 100%. Think of this along the lines of the following: if you earn $100,000 per year and have total debt of $100,000 your debt-to-personal GDP (your total productivity as measured by income) then your ratio is 100%. Going to be hard for you to borrow anymore and at some point it becomes, like my sister, a strain to pay the interest and principal back.

The next chart looks at the change in debt-to-GDP since 2007. Japan is up 64 percentage points, Ireland is up 172 percentage points, Portugal 100, Greece 103, China 83 and the U.S. 16 to name a few.
Also note that, in the U.S., households have been paying down their debt. So have corporations (despite the “borrow and use the proceeds to buy-back stock” game that has been in play). Government debt has grown to account for the expansion of U.S. debt.
My two cents: QE is not going away. It will return. Some combined default, bailout, QE game is necessary to achieve a “beautiful deleveraging.” Soft landing? I have my concerns.
A Quick Look at the Most Recent Valuation Metrics
In short summary: By most measures, equities remain richly priced.
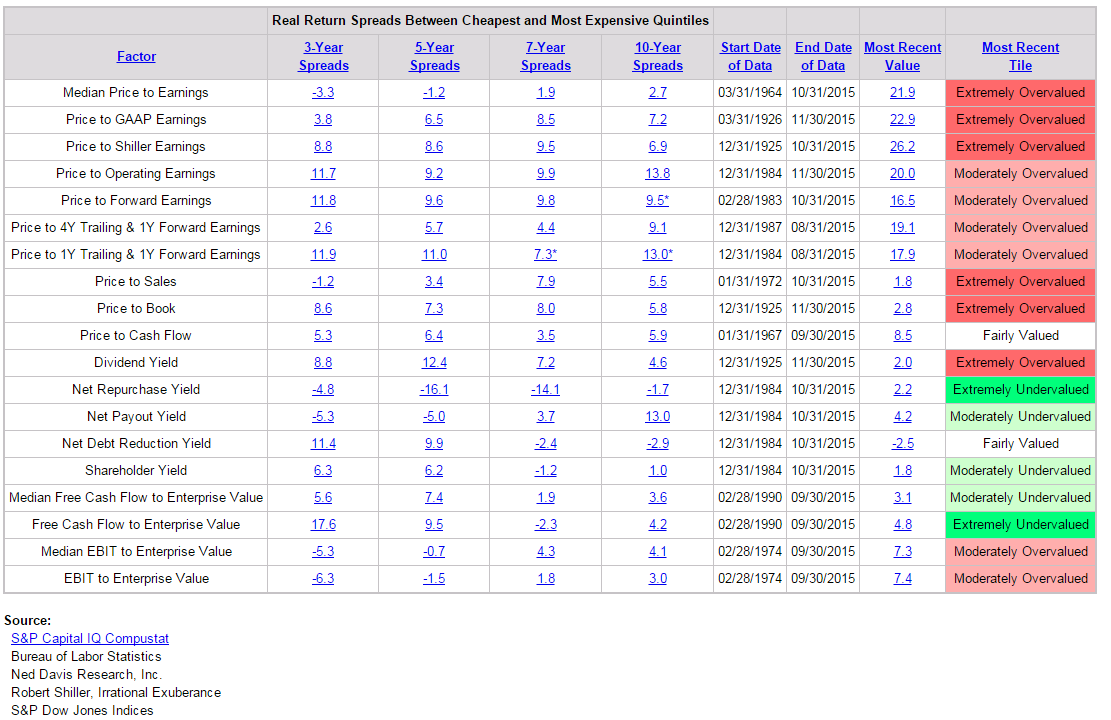
As you may know by now, I favor “median-PE” based on the previous 12 months of actually reported earnings. It reached 22.2 on November 30, 2015. Take a look at prior month-end median-PE figures (left red and green arrows) and the subsequent annualized returns that were achieved 10 years later.
The market is richly priced, expect low forward 10-year annualized returns. It is a time to play defense.
Trade Signals – Seasonal Tendencies, Trend Better, Don’t Fight the Tape or the Fed is Now Neutral
December 2, 2015
There is improvement in several of the charts this week. Don’t Fight the Tape or the Fed has moved back to neutral from -2. For now, that is good news.
You’ll also see that the trend data as measured by a weekly moving average has recently turned bullish on equities. Daily investor sentiment remains far too optimistic which is short-term bearish for equities. Overall the evidence is mixed, the market is expensively priced though seasonal tendencies are positive. Sentiment is mixed, however, short-term sentiment is far too optimistic (which tends to be ST bearish for equities). Ten-year forward returns probabilities are low (predicting 2% and 4%) for equities and yields on bonds remain ultra-low – not the right recipe for the 60/40 (stock/bond) investors looking to gain 8%.
My two cents: Broadly diversify, hedge equity exposure and overweight liquid alternatives (defined as anything other than traditional buy-and-hold stocks and bonds).
Included in this week’s Trade Signals:
Equity Trade Signals:
- CMG NDR Large Cap Momentum Index: Sell Signal – Bearish for Equities
- Long-term Trend (13/34-Week EMA) on the S&P 500 Index: Buy Signal – Bullish for Stocks
- Volume Demand is greater than Volume Supply: Sell Signal – Bearish for Stocks
- NDR Big Mo: Buy Signal – Bullish for Stocks
Investor Sentiment Indicators:
- NDR Crowd Sentiment Poll: Neutral Optimism (short-term Neutral for Equities)
- Daily Trading Sentiment Composite: Excessive Optimism (short-term Bearish for Equities)
Fixed Income Trade Signals:
- The Zweig Bond Model: Buy Signal
- High Yield Model: Sell Signal
Economic Indicators:
- Don’t Fight the Tape or the Fed: Indicator Reading = 0 (Neutral for Equities)
- Global Recession Watch Indicator – High Global Recession Risk
- U.S. Recession Watch Indicator – Low U.S. Recession Risk
Click here for the link to the charts.
Personal note – Stuffing Balls, Slippers and The Nana Bag
Thanksgiving couldn’t have been better. Susan cooked for 16, the meal was awesome, the touch football game was great fun and the time together was simple and happy.
After Thanksgiving, Linda, our Client Relations Manager, and I shared some stories with each other. I told her about Grammy Eilene’s “stuffing balls” and how that has become something important to my children. I really underappreciated how much that part of the meal was to them. This year we decided to have the kids make the stuffing balls. After the initial “are you kidding us”, all turned out well and I think they felt part of something more important. Family, love, home. Priceless…
Linda shared how her little boy, Matt (now not so little at age 33) on Christmas mornings would go into his closet and bring out his gift for her. Each year it was a new pair of slippers. Santa placed them in the closest for him to give to his mother. Nana, Linda’s mother, made sure this happened year after year. There was also a gift from Nana to Linda. It was a gift bag full of goodies that became known as “The Nana Bag”. Every year, new slippers and the Nana Bag.
Today is the ten year anniversary of Nana’s passing and Matt still makes sure that slippers are under the tree every Christmas morning. And Linda gifts the Nana Bag to Matt and his wife, Jenn. They get so excited to see what is in the Nana Bag. And so, tradition lives on. Pretty cool. I bet Nana is watching with a big smile on her face.
Here is a toast and a hat tip to the stories that light up your family. I hope you had a wonderful Thanksgiving.
A few weeks of travel is immediately ahead then it slows down. I’ll be presenting next Tuesday on Portfolio Construction and Best Execution at the IMN Global Indexing and ETF Summit in Scottsdale, Arizona on December 6-8. The speaker lineup is outstanding. Mohamad El-Erian is the keynote. I’m a big fan and will share with you what I learn in a future post.
Salt Lake City follows on December 12-16. I hear that a snow storm is probable. That would be a really nice bonus as I plan to sneak in some skiing around the business meetings that are lined up. Then it is a trip home through Dallas and a short brainstorming session with my great friend John Mauldin. A few days in NYC before Christmas then home through the holiday. December already. Time is moving much too fast.
Have a wonderful weekend!
With kind regards,
Steve
Stephen B. Blumenthal
Chairman & CEO
CMG Capital Management Group, Inc.


