
“Davidson” Submits:
This week has been full of data releases which continue to receive negative ‘expert media’ bias. Applying ones’ critical thinking is all about not letting your emotions rule your analytical judgment. Unfortunately, it is rarely the case that what we hear from the consensus is free from emotion. As usual, it was all about who could guess this month’s Establishment employment number. Those who were on target were praised as ‘experts’. Those who missed even by a few thousand were simply ‘not-experts’ and lost face time. No one seemed to notice that the last couple of months of Establishment releases were revised higher by more than it took to relegate current guesses to the ‘not-expert’ trash bin. Such is the gaming which goes on instead of the critical thinking required for viable economic analysis. Excerpted comments from today’s release are below.
Excerpted comments from the BLS press release:
“Total nonfarm payroll employment rose by 215,000 in July, compared with an average monthly gain of 246,000 over the prior 12 months.”
“The change in total nonfarm payroll employment for May was revised from +254,000 to +260,000, and the change for June was revised from +223,000 to +231,000. With these revisions, employment gains in May and June combined were 14,000 higher than previously reported. Over the past 3 months, job gains have averaged 235,000 per month”
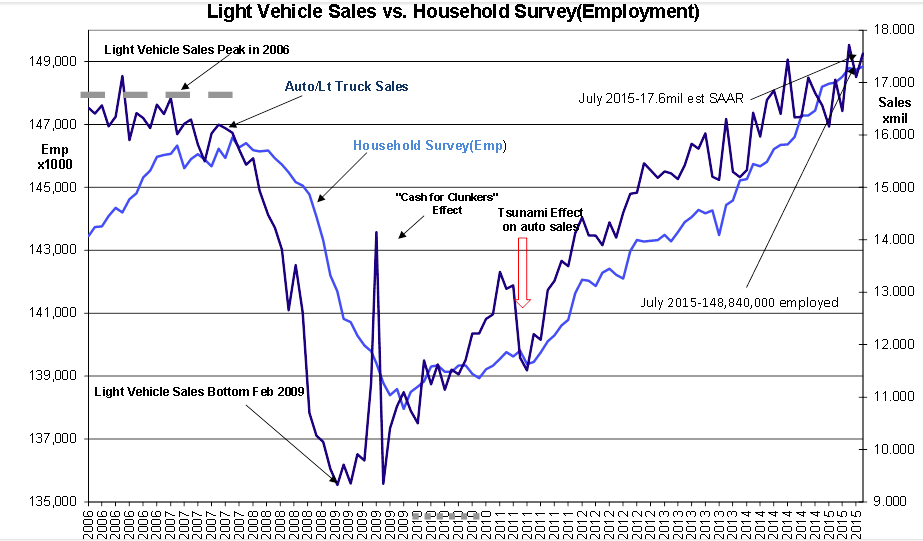
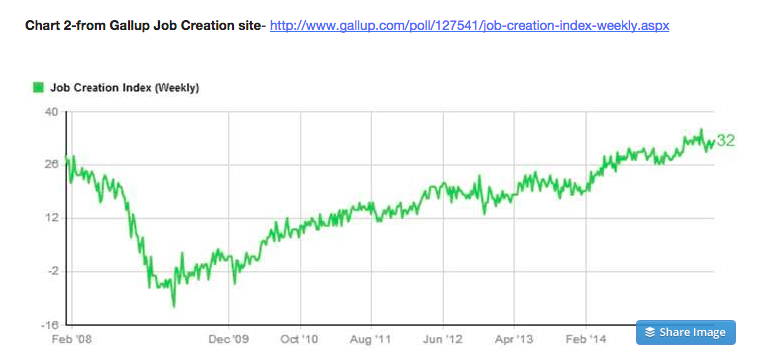
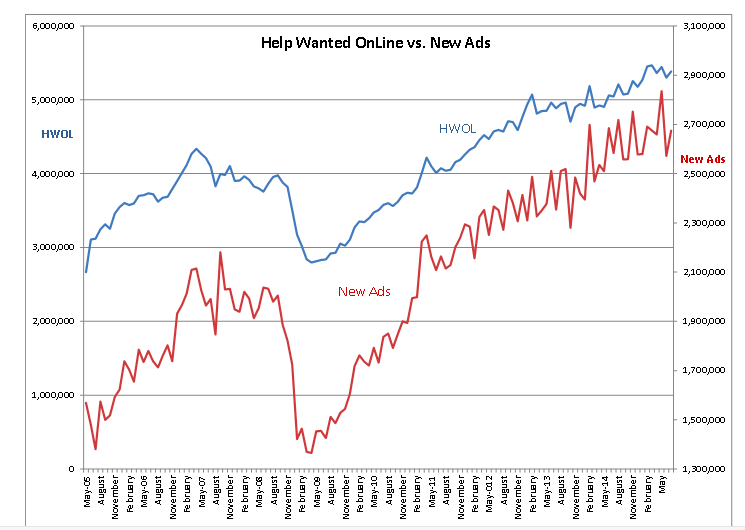
Net/net Employment and Vehicle Sales trends continue to move higher-see Chart 1 – Light Vehicle Sales vs. Household Survey(Employment). These economic trends have a history of stalling ~12mos prior to stock market peaks and there are no signs of stalling reflected in this data. Also showing no signs of stalling are the Gallup Job Creation Index-Chart 2 and the Conference Board’s Help Wanted Online Index(HWOL)-Chart 3. The Gallup Job Creation and Conference Board HWOL indices tend to stall several months prior to other economic indicators. At all times, one must look at multiple economic indicators to judge the direction of an economy because any economic trend is composed of many sectors. All continue to look decent.
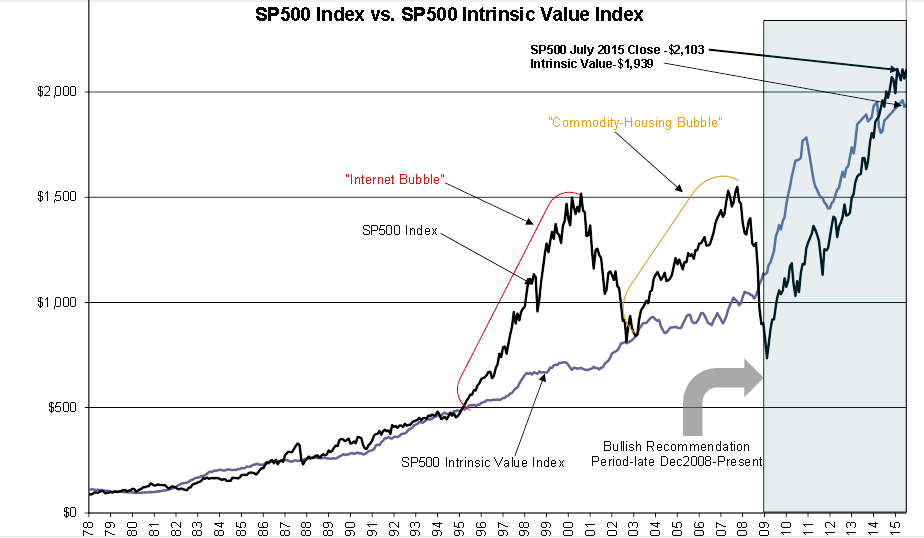
I monitor a unique indicator which I title the SP500 Intrinsic Value Index shown as Chart 4. It is based on the observation that market prices are based on two quite divergent market psychologies, i.e. Value Investor Psychology vs. Momentum Investor Psychology. Value Investors deploy (in general) greater use of critical thinking of business returns vs. general economic returns. It is Value Investors who buy equities at major market lows thus creating recessionary lows. It is Value Investor’s long term views incorporating more often than not a strong appreciation for history which guides them to seeing value in assets currently losing money. The Value Investor expectations of financial recovery has centuries of historical support. Value Investors have a long term return economic context by which they gauge SP500 pricing. This is the basis behind the SP500 Intrinsic Value Index. It is inflation sensitive and uses the Dallas Feds 12mo Trimmed Mean PCE which was reported at 1.7 this morning-see Table. Higher inflation results in Value Investors lowering the prices they are willing to pay for expected cash returns.
Momentum Investors on the other hand believe markets ‘magically’ seem to know more than anyone investor can ever know. They monitor trends and once convinced, invest to extend the trends they perceive. Typical of Momentum Investor behavior is believing that current market prices reflect all that can be known. This is why we often see sharp price movements when unexpected news is released. This is why markets rise on continued good news to excessive price levels which we witness at the end of every economic cycle. Market excesses have been particularly accelerated with the dominance of Hedge Funds since min-1990s.
While Value Investors typically dominate market pricing at the major market lows, Momentum Investors dominate pricing at market highs. There are many more Momentum Investors than there are Value Investors! The difference between the SP500 Intrinsic Value Index and the SP500 reflects whether Value Investor or Momentum Investor psychology is having the greatest impact on market pricing. Economic uptrends cause market psychology to shift gradually from a position of excess pessimism to one of excess optimism. Obviously, excess market optimism is dominated by trend followers and excess valuations. Momentum Investors only recognize an economic slowdown after the fact. The resulting panic to exit is why major market corrections are so painful. Currently, market psychology is about neutral in my opinion.
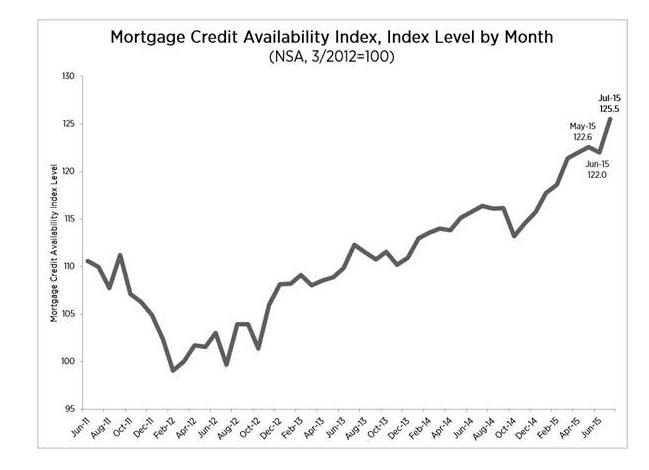
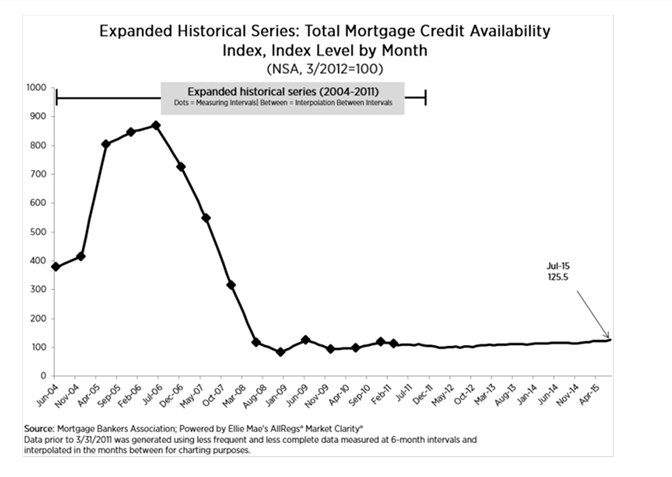
Charts 5&6 foretell our future in my opinion. The Mortgage Banker Mortgage Credit Availability Index(MCAI) jumped to 125.5 in July 2015. This recovery has continued to be beset with pessimism as anyone listening to today’s media commentary can readily attest. What has been missing is ‘The Wealth Effect’ which many relate to individual wealth being created in a healthy housing market. We have not had our typical housing recovery. Primarily this has been due to tight lending conditions as shown in these charts. If we take the June 2004 reading at just over 300 as closer to normal before Sub-Prime lending went off the charts, then our current level of 125.5 remains quite low. But, recent stories of bank lending beginning to loosen the reins a bit on Jumbo Mtgs have appeared and is reflected in the July pop to 125.5. If access to mortgages continues to improve, then we should see the housing sector return to historical levels and investor psychology should shift far more into positive territory. If credit spreads widen for lending institutions, then we should see MCAI rise much closer to 300. Home building, employment, Vehicle and Retail Sales should all rise accordingly and market psychology should cause a strong shift from Fixed Income to Equity.
In my opinion, the next 5yrs or so look quite positive for stocks ($SPY) , especially LgCap Domestic&Intl and NatResource issues.

The post Positive Signs Everywhere appeared first on ValuePlays.


