
How to Deconstruct Analyst EPS Estimates to Detect Overoptimism Written by Jae Jun follow me on Facebook Twitter
X-Men.
Spiderman.
My occasional cooking.
These things show that some of the coolest things happen from side effects.
As I’ve been digging deeper into the EBIT multiple calculator recently implemented into the Stock Analysis Tool, I made an accidental discovery.

In all the stock valuation methods that I use, I’ve gone over how you can do it in reverse to gauge the expectations for a stock.
With a DCF, you do a reverse DCF to see what growth rate estimates are being assumed by the market at the current price.
The reverse Graham method gives you a ballpark growth estimate based on the EPS.
With EPV, since it ignores growth to begin with, you can see what value the market is placing on its reproduction value and earnings power.
Using the EBIT multiple method, it’s easy to start with the analyst EPS and then work your way up to figure out what the expected revenue is for the upcoming year based on that EPS.
Reverse Engineer the EPS to Detect Optimisim

Now I’m liking this idea more each day because it provides a very simple frame of reference.
Let me explain.
Let’s say you did a reverse DCF and the current price is assuming a growth rate of 13%.
Great.
But what is that 13%?
Since 13% is not an absolute number, it’s difficult to fully capture the meaning behind it.
Compare it to revenue.
If a company has managed to grow sales to $1M at 15% a year, but reverse engineering an analysts EPS shows that the expected revenue for the next year is $2M (a 100% jump), how likely are you to believe that EPS estimate?
See how simple it is to check how realistic an analyst estimate is?
Analyst estimates are overly optimistic so it’s always a good idea to check.
 Optimistic Analyst Estimates
Why Analysts are Overly Optimistic with VistaPrint (VPRT)
BeyondProxy.com posted a commentary on VistaPrint which I liked and wanted to look more into.
After all, I’m very familiar with the company and printing industry. Maybe the recent 20% drop was an opportunity so I wanted to see whether it was cheap enough to consider.
Over the past few years, margins have been getting hammered.
When you do a forward looking valuation, it’s best to take a 5 year or 10 year normalized period to see what the intrinsic value will be if the company gets back to “normal”. Then do the same for a shorter period for the bleak valuation. This will give you a range and an idea of what to expect.
(I’ll show you how to normalize values in the following sections)
However, when you do any sort of reverse stock valuation, you should always use a much shorter period. You want to see what the expectations are with the stock now.
So starting with the analyst EPS of $2.73, if I use a short 3 year normalized period, the expected revenue turns out to be $1,734M in the coming year.
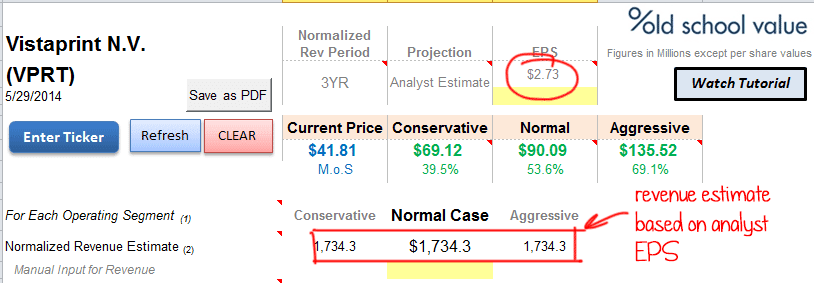
Compare that to the TTM revenue of $1,213M.
 Vistaprint Revenues | Enlarge
$1,734M is way too optimistic compared to the growth over the past 3 years.
A better way is to use a simple normalized EPS.
In this case, the normalized EPS I’m using is $1.99.
For OSV users, just flip the selection to Normalized EPS to see what you get.
 Vistaprint Reverse Revenue using Normalized EPS | Enlarge
The expected revenue using an EPS of $1.99 is much closer to what you would expect.
Easy right?
Here’s a video I put up recently going through the EBIT method.
Well, if you aren’t a member of old school value, I’ll give you step by step instructions on how to do this manually.
But you must understand how to normalize numbers first.
How to Normalize Earnings
To normalize earnings, I’m just following what Prof Damodaran teaches. Here’s the original page on normalizing earnings which includes extra commentary on when to use it and how to think about it.
I’ve taken the part that tells you how it should be done.
Average the firm’s return on investment or profit margins over prior periods:
This approach is similar to the first one, but the averaging is done on scaled earnings instead of dollar earnings.
The advantage of the approach is that it allows the normalized earnings estimate to reflect the current size of the firm. Thus, a firm with an average return on capital of 12% over prior periods and a current capital invested of $1,000 million would have normalized operating income of $120 million.
Using average return on equity and book value of equity yields normalized net income.
A close variant of this approach is to estimate the average operating or net margin in prior periods and apply this margin to current revenues to arrive at normalized operating or net income.
The advantage of working with revenues is that they are less susceptible to manipulation by accountants.
Step by Step Guide to Normalizing Earnings
So in the example above there are two ways to normalize earnings.
- Using the average ROE to find net income
- Get the average net margin and multiply to current revenues
Let’s take a look at both.
Using Average ROE to Get Normalized Earnings
Step 1. Get 3 to 5 years of ROE
Step 2. Average the ROE
Step 3. Multiply the average ROE from Step2 with the shareholders equity found in the latest quarterly statement
Step 4. Divide the value from step 3 by shares outstanding to get normalized earnings.
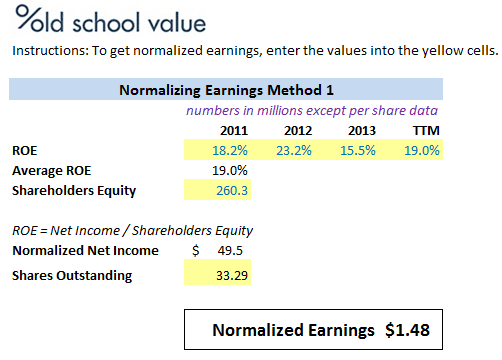 Normalize Earnings using Average ROE
Using Average Net Margin to Get Normalized Earnings
Step 1. Get 3 to 5 years of net margin
Step 2. Average the net margins
Step 3. Multiply the average net margins from Step2 with the latest revenue numbers to get the normalized net income. I like to use the TTM revenue value.
Step 4. Divide the value from step 3 by shares outstanding to get normalized earnings
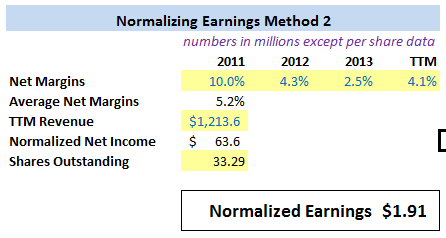 Normalize Earnings using Net Margins
As you can see there are differences between the two methods. Choose the method that you like.
I’m using the net margins method because it gives a better indication of the business cycles and I’ve adjusted my version to use median numbers instead of averages.
That’s why the value of $1.99 used in the example is slightly higher that what you see here.
Download This Spreadsheet to Calculate Normalized Earnings
Get a copy of the above spreadsheet to calculate normalized earnings here.
(If you are reading from email, you must come to the blog to download it)
![]()
But Isn’t Revenue Unreliable because It’s Easy to Manipulate?
Revenue is easy to game, but not manipulate.
Prof Damodaran says it himself.
The advantage of working with revenues is that they are less susceptible to manipulation by accountants.
And the reason is because while you can game when the revenue is recognized but you can’t fake what the price of a product or service is and how much a customer paid.
Sure, many companies want to meet sales goals so they offer certain discounts and incentives to customers if a purchase is made within the quarter.
But at the end of the day, the revenue line is still important.
After all, it’s what the product/service costs. You can’t play around with basic prices.
In the private sector where there is no luxury of EPS and shares outstanding to calculate all sorts of stock valuation ratios, revenue plays a big role. Even in the private online world, websites are sold based on a multiple of revenue or normalized net income.
What Do You Think About Deconstructing the Analyst EPS to Gauge Sentiment?
Using this method, it’s easier than ever to get an idea of the sentiment towards a stocks.
Previously I was doing reverse valuations to get the expectations. This is another method that makes it even easier.
What do you think?
Disclosure: None


