Investment Strategy by Jeff Saut
“Changes in Latitudes, Changes in Attitudes…”
March 10, 2014
These changes in latitudes, changes in attitudes,
Nothing remains quite the same.
Through all of the islands and all of the highlands,
If we couldn’t laugh we would all go insane
… Jimmy Buffett (1977)
As many of you know, I travel a lot to speak at events and see portfolio managers (PMs). Last week my travels took me to Orlando for the Raymond James 35th Annual Institutional Investors Conference, which was attended by roughly 900 PMs and analysts and 300 presenting companies. During a number of conversations with various folks from Europe it was suggested that inflation in the U.S. had increased noticeably. Now I know the government’s official inflation statistics belie that assertion, but as Yogi Berra said, “You can observe a lot by just watchin’.” And watchin’, ladies and gentlemen, shows inflation is higher than the government is telling us. Subsequently, I received this quip from my friend, the always keen-sighted Doug Kass, who wrote:
Rising inflation and slowing real growth are value-destructive factors to the U.S. stock market. The inflation voices are rumbling. The five-year breakeven today has jumped above 2% for the first time since May. This will serve to slow domestic economic growth in the months ahead. Rising inflation and slowing real growth are value-destructive factors to the U.S. stock market. The attendant chart from Deutsche Bank (chart 1) shows that when wages begin to move higher, inflation takes hold.
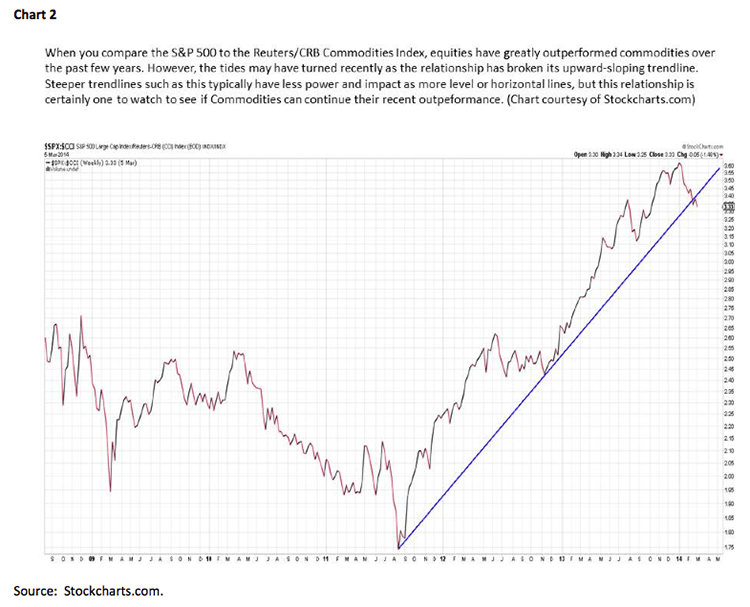
While at this point I do not agree with the “value-destructive and slowing real growth” statement, my interest was indeed piqued and I decided to look at the S&P 500 (SPX/1878.04) chart relative to the Continuous Commodity Contract (see chart 2). Notice that when the price chart is rising, stocks are outperforming commodities. The reciprocal is that when the price chart is declining, commodities are outperforming stocks. Recently, said chart has been in decline such that the price has broken below a major ascending trendline, which has been intact since October 2012. It might be that this is just a short-term aberration, but when taken in concert with the fact the PowerShares DB Agricultural ETF (DBA/$28.38) has rallied ~18% YTD (chart 3), it potentially implies a change in the direction of inflation.
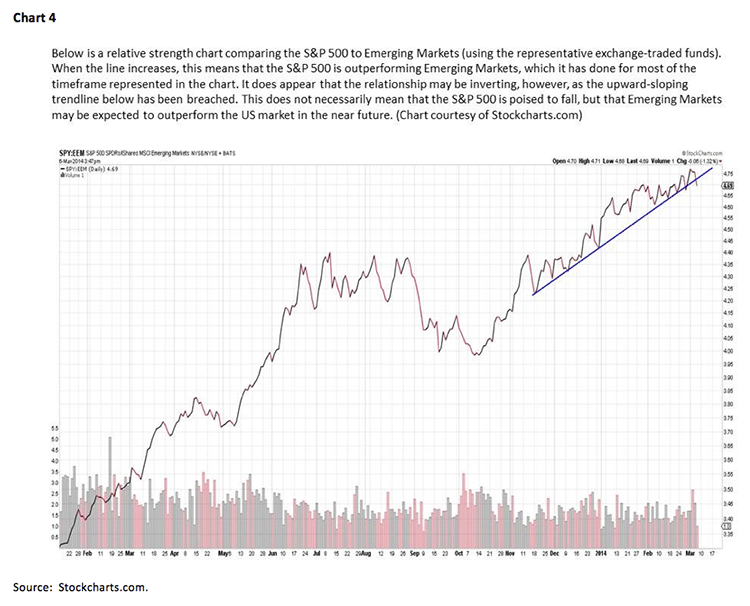
Also of interest on the “changes in latitudes, changes in attitudes” is that using the same type of chart, comparing the SPX to the Emerging Markets ETF (EEM/$39.52), shows a similar potential reversal in that while U.S. equity markets have been outperforming emerging markets (EMs), recently that relationship seems to have changed (chart 4). Hereto, notice that when the direction of the chart is rising U.S. stocks are outperforming EM, but when the price is declining EMs are outperforming U.S. stocks. As in chart 3, a major trendline has been broken to the downside, suggesting the potential for a change in trend. While this also may be a short-term aberration, it bears watching.
Speaking to “slowing real growth,” the recent (January) nominal personal spending report was intriguing. Intriguing because nominal personal spending rose a much larger than expected +0.4% versus the consensus estimate of +0.1% (chart 5). The two service categories that drove spending were household utilities (+9.7%), which was weather-induced, and healthcare (+1.6%). The healthcare spend was prompted by enrollments due to the Affordable Care Act (i.e. Obamacare). Since both of these factors are included in the upcoming GDP report, it is expected to have a stronger tilt.
To be sure, the equity markets seem to believe the economy is getting stronger because the economically sensitive D-J Transportation Average ($TRAN/7592.36) traded to a new all-time high last week, thus producing one-half of a Dow Theory “buy signal.” If the D-J Industrial Average ($INDU/16452.72) can do the same by surpassing its December 31, 2013 all-time closing high of 16576.66 it will render yet again a full Dow Theory “buy signal.” That would be an appropriate way to celebrate the five-year anniversary of the March 9, 2009 closing low for the senior index. Verily, five years ago this month I stood on stage at the Raymond James national conference in Las Vegas and told 3,000 despondent financial advisors to take heart because the stock market had bottomed. Since then we have had more than a dozen Dow Theory “buy signals,” so another one this week would be nice. Yet, naysayers continue to doubt we are in a secular bull market. One of the main “cat calls” is that the current “bull” is long of tooth at 60 months old because the average “bull” only lasts for 50 months. In past reports I have addressed this, but I will do so again.
NOBODY measures the 1982 to 2000 secular bull market from its nominal price low of December 6, 1974 (the lowest price the INDU would trade at of 577.60). Rather they measure the beginning of the 1982 – 2000 bull market from the valuation low of August 12, 1982 at 776.92 (the cheapest the INDU would get in terms of price/earnings, price/book, price/sales, etc.). So why do pundits insist on measuring this bull market from its nominal price low of March 2009, instead of its valuation low of October 2011? Using that as your starting point makes the current rally only 29 months in duration. Irrespective of that, I continue to believe we are in a secular bull market that has years left to run; a point of view confirmed by my friend Rich Bernstein, the former strategist at Merrill Lynch. He and I actually did a video about this a week ago while discussing the American Industrial Renaissance and the two Eaton Vance funds he manages to that theme (EARAX/$12.74; ERBAX/$14.60), as well as the First Trust UIT he manages (FWRVLX/$11.12).
Circling back to our conference, I heard numerous decent risk-adjusted ideas that play to my various themes and are positively rated by our fundamental analysts. One of them was Goodrich Petroleum (GDP/$14.95/Outperform), which has a 6%+ yielding convertible preferred (GDPAN/$39.00). As always, terms and details should be checked before purchase.
The call for this week: Stocks closed trendless on Friday right in the middle of their daily range in what a technical analyst would term a Doji formation (+). That implies news will determine the stock market’s very short-term direction. Year-to-date the INDU is down 0.75%, but the TRAN made a new all-time high last week and is up 2.59% YTD. If the INDU can better its all-time high of 16576.66 it would be another Dow Theory “buy signal.” If it doesn’t, we may have an upside non-confirmation that causes a pullback attempt before we better 1900 on the SPX. However, as investors’ attentions have been focused on the major averages’ strong comeback from their February 3rd lows, the Dow Jones/UBS Commodity Index is up 8.02% YTD. More importantly, natural gas is better by 10.31%, corn by 14.43%, gold has gained 10.86%, and coffee is up an eye-popping 73.98% YTD. The result feels to me like the “worm has turned” and that commodities have begun a rally that has upside “legs.” Interestingly, emerging markets have tended to rally when commodities rally, but as of yet that has not happened this year, although as stated … this too may be changing. If so, one way to play that theme is via the MFS International Diversification Fund (MDIDX/$16.34) managed by my friend Thomas Melendez.