
By Jacob L. Taylor and Lonnie J. of Farnam Investments
“If you’re a basketball coach, you’re probably not going to arbitrarily hire a 5’6? player. You know there may be exceptions, but in general, you’re looking for a 7-footer.”
— Warren E. Buffett
The average male human is 5’8″ tall; most people fall somewhere close to that average. The average NBA player is 6’7″ tall, which is obviously a quite rare height for a human.
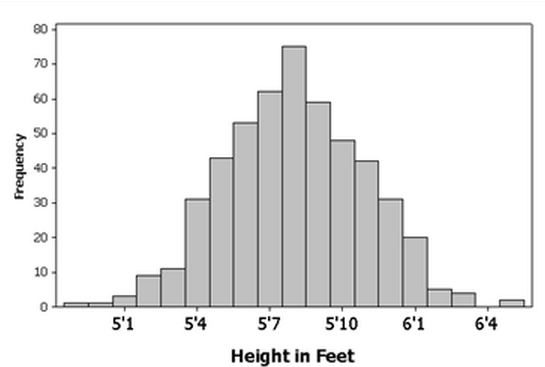
During an average year, with average market prices, a typical company will sell for 15 times last year’s earnings. So a 15x multiple equates to 5’8” on this normal distribution. Benjamin Graham, the father of value investing and a mentor to Warren Buffett (Trades, Portfolio), preferred to only buy stocks that were selling for a P/E of 8x or less, almost half as cheap as the normal price businesses typically trade for. He was a real bargain shopper.
Just like being tall usually conveys some advantages on the basketball court, research shows definitively that buying stocks when they’re cheap will provide better returns than buying them when they are expensive. There’s no bigger driver of investment success than the price that is paid: valuation is king. Paying less for something sounds like a no-brainer good idea, but for some reason people develop feelings of euphoria from higher prices, and panicked dismay from lower prices when it comes to their purchase of partial ownership of publicly traded companies.
Whether you’re an NBA GM hunting for tall people or a fund manager looking for attractive investments, it’s important to understand the statistical makeup of the population you’re exploring. Imagine that you visit a tribe where for some reason, everyone was clustered around the same height of 5’2″. Everyone is short — would you expect to find a lot of potential NBA players in that tribe? Probably not (our apologies to Muggsy Bogues). Now imagine a tribe where everyone was at least 6’7”. There are likely a greater number of NBA-size people in that group.
There have been times when markets have had extremely low P/E ratios across the board because of general investor pessimism. People simply wouldn’t pay as much for $1 worth of earnings from the average business, which means there are deals to be had for those who don’t need the warmth of a rosy outlook to take action. Those low P/E times have often resulted in spectacular returns for investors, just like a “tall” tribe would be more fruitful in yielding NBA-sized people. The greatest bull market run in history started in 1982 from a P/E of just 8x. You can basically throw a dart and find something with an attractive risk-reward profile when markets are really cheap. Conversely, there have been times when markets have had very high average prices, which have subsequently performed very poorly for investors. These bubble times are the equivalent of finding the pygmy tribe yielding little NBA-level height.
The average height of the tribe or P/E level of the stock market is pretty straightforward and simple when the observations are tightly clumped around a high or low average (tall is greater than short, cheap is greater than expensive). Where it gets interesting is when the numbers are widely spread around the average and the shape of the statistical distribution changes (higher variance and higher kurtosis). Imagine you discovered a tribe that had an extremely wide range of heights, from 5’0” to 7’0”. Even if the average height was the standard 5’8”, the odds of finding an NBA-height person are pretty good because of the wide spread. It pays to dig deep for a winner in that tribe.
The same is true of finding attractively priced businesses in the stock market. When there’s a wide range of cheap and expensive, the thoughtful investor can still find deals, even if the averages are generally high.
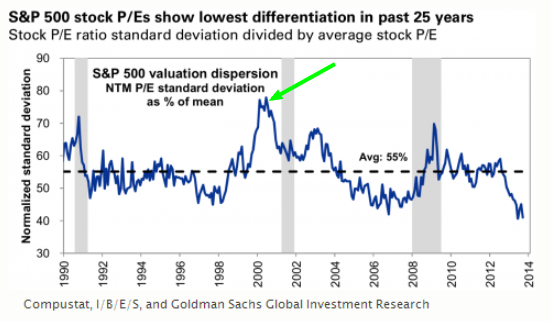
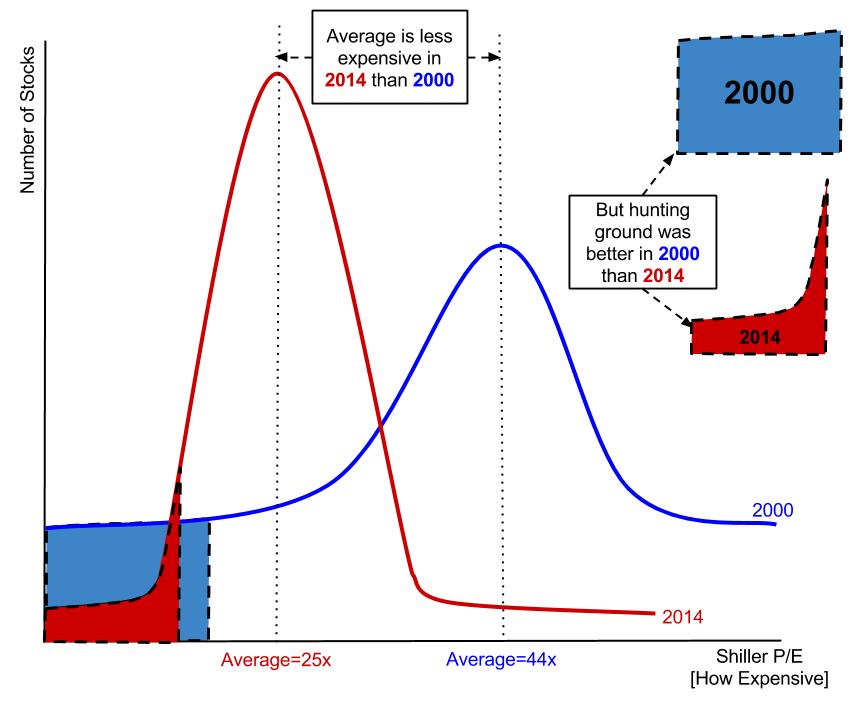
This is exactly what we saw in 2000 to 2001. Because of the disruptive arrival of the Internet, many stocks were priced to the moon, while some were being practically given away. The prevailing narrative was that new-economy internet stocks were the wave of the future and old-economy stocks were soon-to-be-extinct dinosaurs. This created a two-tiered market with a record high average price (the Shiller P/E was 44.2 in December 1999!), but a plethora of deals are available at the bottom. The chart below shows that time frame having a record high dispersion; it was a tribe with an incredibly wide range of heights to choose from.
It’s little wonder that stocks bought around that time using Joel Greenblatt (Trades, Portfolio)’s Magic Formula criteria (which systematically buys the lowest P/E stocks available) had spectacular subsequent out-performance. What it was buying had a huge edge vs. the market average because of the localized pessimism around brick-and-mortar businesses and the irrational exuberance around anything dot-com. The Magic Formula crushed it:
| Year | Magic Formula Returns | S&P 500 Returns | Difference |
| 2000 | 7.9% | -9.1% | +17.0% |
| 2001 | 69.6% | -11.9% | +81.5% |
| 2002 | -4.0% | -22.1% | +18.1% |
| 2003 | 79.9% | 28.7% | +51.2% |
| Cumulative | 216.0% | -19.7% | +235.7% |
Anecdotally, there were numerous value-minded money managers who made a name for themselves or cemented their legacies because of the wide dispersion opportunity that the market presented to them at that time. It was a true value investor’s paradise and they delivered impressive returns!
| Manager | 2000-2004 | S&P 500 (2000-2004) | Difference |
| Mohnish Pabrai (Trades, Portfolio)- PIF2 | 195.7%* | -19.7% | +215.4% |
| Bruce Berkowitz (Trades, Portfolio)- FAIRX | 81.0% | -19.7% | +100.7% |
| Donald Yacktman (Trades, Portfolio)- YACKX | 70.5% | -19.7% | +90.2% |
| Warren Buffett (Trades, Portfolio)- BRKA | 59.2% | -19.7% | +79.8% |
| Marty Whitman- TASCX | 54.4% | -19.7% | +74.1% |
* Number slight adjusted for different reporting time periods.
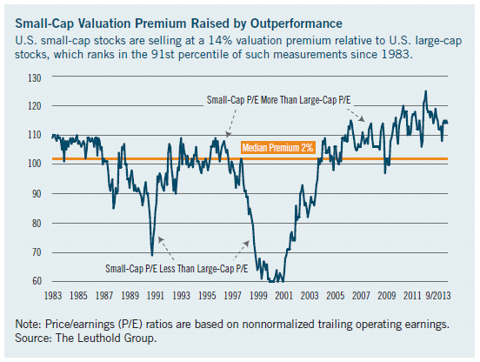
There was something else going on at that time that contributed to the relative out-performance: a big valuation premium for large cap stocks compared to small. Many smaller businesses were on sale, offering up some incredible opportunities that both the Magic Formula and the value managers took full advantage of.
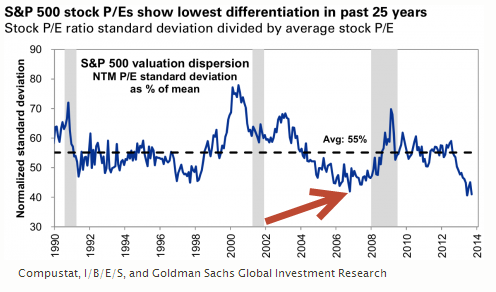
Back to our original dispersion chart, notice the 2006 through 2008 time period had a relatively low dispersion:
Here’s how the Magic Formula fared during that time vs. the market:
| Year | Magic Formula Returns | S&P 500 Returns | Difference |
| 2006 | 28.5% | 15.5% | +12.7% |
| 2007 | -8.8% | 5.5% | -14.3% |
| 2008 | -39.3% | -37.0% | -2.3% |
| Cumulative | -28.9% | -23.0% | -5.9% |
Not so magic because it wasn’t able to find investments that were dissimilar enough from the market averages. The bunching was too tight; there was no edge!
So what type of market do we find ourselves with today? Unfortunately, it’s a tribe of pygmies highly clumped around a very diminutive average. There’s hardly an NBA player in sight!

Looking back at our dispersion chart above, we’re currently at a 25-year low, meaning the cheapest 10% of the market looks an awful lot like the other 90%. And if you normalize earnings at all, the current P/E is extremely high with the Shiller CAPE at 25x. Prices are expensive and tightly packed around the average, meaning we shouldn’t expect very good returns from here. In fact by some statistical thresholds that we’ve already crossed, it’s one of the top five most dangerous markets of all time. It will be extremely difficult to be a stock picking hero in this environment. Even though the 2000 market average was higher than today, the 2000 time frame delivered a much better hunting ground.
 [ Enlarge Image ]
Value investors are known for ignoring “macro” developments and relying solely on their skills as bottom-up stock pickers. Their depth of research is usually unparalleled, but there’s a general hesitancy in considering broader market valuations in their analysis. We’re value investors through and through, but we think it’s a mistake not to pay attention to what the current investment opportunity set looks like compared to different points in history. The composition of the tribe you’re examining is important: it’s hard to find NBA players in a group of same-sized pygmies! And picking the biggest pygmy just because they’re relatively taller than the rest isn’t a recipe for hardwood success.
So stock picking isn’t likely to be as useful, and returns will be poor based on the current prices — what is the prudent investor to do? Our answer is… nothing! Don’t participate; there’s no called third strike in investing. Although it’s difficult to hold cash in a tightly packed, low-yield market like today’s, that’s exactly what we’re doing. We’ve found a few ideas that we believe will readily outperform — enough to fill up approximately 30% of our clients’ portfolios. But the rest is in cash awaiting a better, more dispersed opportunity set — a whole new tribe if you will. We don’t know how long it will take, but we firmly believe our patience will be rewarded with some true seven-footers.
We’ll leave the last words to Charlie:
“It takes character to sit there with all that cash and do nothing. I didn’t get to where I am by going after mediocre opportunities.”
— Charles T. Munger
Jacob L. Taylor and Lonnie J. Rush are visiting assistant professors at the UC Davis Graduate School of Management where they teach Value Investing. They founded Farnam Street Investments, a boutique investment firm modeled after Warren Buffett’s successful 1950’s partnerships. FSI offers a hedge fund that gives sophisticated, high net worth investors the opportunity join an emerging Buffett-like partnership. They differentiate themselves by applying Mr. Buffett’s criteria to every stock in the known universe, with a special focus on smaller cap stocks. Like Mr. Buffett started with “A” in the Moody’s manual all those years ago, they spend their time scouring the globe for high-quality businesses that are selling for unreasonable prices. They welcome being contacted at [email protected].


