
I’ve been saying here all year long that the employment picture was stronger than people we giving it credit for. This is mainly because while the gov’t sector is shrinking, the private sector has been filling the void. When the gov’t stops shrinking its payrolls, the strength of the private sector will be more apparent.
“Davidson” submits:
The week to week readings for the ASA Staffing Index and the Gallup Job Creation Index provide an almost real time measure of the employment trend in between the monthly employment reports. Both indicators continue in positive trends. The Gallup data reveals a small decline with the government shutdown which has since been reversed- see Chart 2: Gallup Job Creation Index-but the ASA index has continued unperturbed and now sits at 102- see the PURPLE-BLUE LINE in Chart 1: ASA Staffing Index. The ASA Staffing Index now sits higher than any other previous year but for 2007.
As goes employment, so goes the market!
The Bigger Picture
The history of the US economy reveals that fairly simple relationships are good at forecasting the direction of economic activity. If employment is expanding, then the economy is expanding! The equity markets will follow. There are a number of indicators which predict the trends of employment, i.e. Monthly Supply of (new) Homes for Sale, Light Weight Vehicle Sales, Temp Hiring, Treasury Credit Spreads and Help Wanted Advertising. One might expect that if we all have the same access to the data, then it should be relatively easy to develop a consensus. It is simply not that simple!
Many tend to use the broad economic measures on which to base their forecasts. Today they see sluggish employment trends and believe stocks are not justified at current levels. This is where I differ and offer an alternative view. In my opinion we are in a typical economic recovery with a couple of wrinkles. Wrinkle #1: is that the Government Sector is shrinking which muddies any economic analysis based solely on GDP or Real GDP without peering into the impact of Government separately from the rest of the economy, the Private Sector. Wrinkle #2: is the Fed’s trying to lower long term rates through QE (Quantitative Easing) believing this to be a benefit to increased lending which, I disagree. I believe that low longer term rates actually impede the normal course of lending by keeping credit spreads between the cost of funds and lending rates lower than normal levels. Wrinkle #2 is for next week when the focus is on the Mtg Banker’s Mortgage Credit Availability Index (MCAI).
Wrinkle #1 hides employment and the economic data which are better than we think! Chart 3: US Real GDP vs. Real Gvt Expenditure shows US Real GDP, Real GDP minus Government Expenditure and Government Expenditure trends. The combined Real GDP which appears sluggish growing at just over 2% can be seen to be a combination of the Private Sector Real GDP growing decently higher than 3% while Government Expenditure is actually falling at a pace close to -2%. The Private Sector has a better growth pace than many currently appreciate.
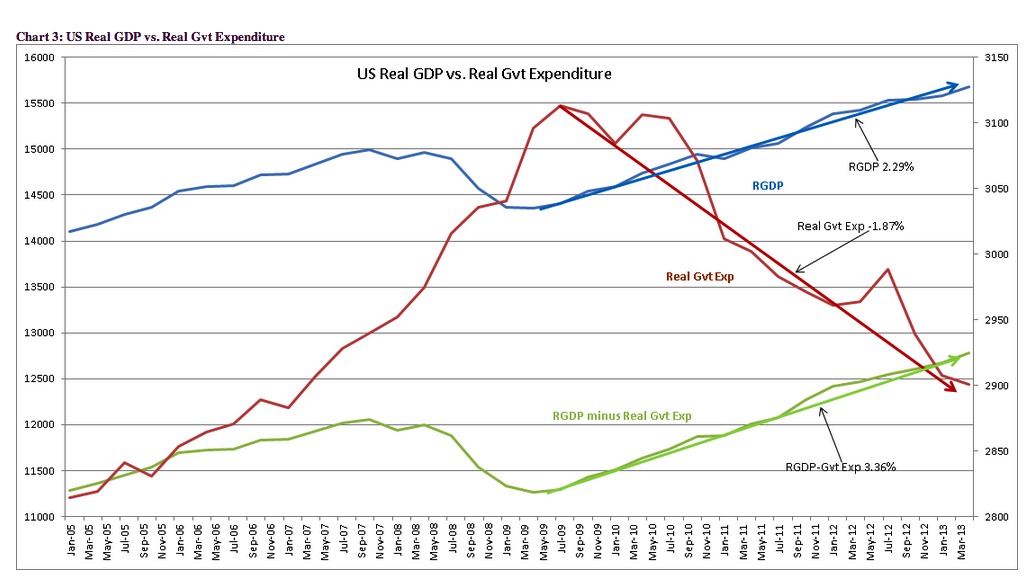
The Private Sector has a better growth pace than many currently appreciate.
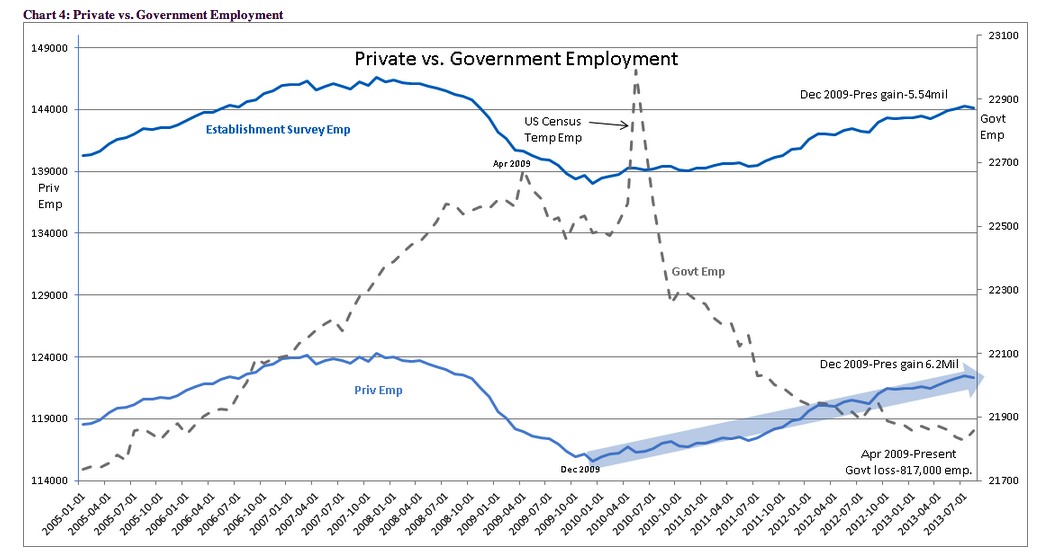
In Chart 4: Private vs. Government Employment the employment impact from the Government Sector is isolated from that of Household Survey. Just as Government Sector Expenditure is falling so is Government Employment! Government Employment rolls have declined by 813,000 from the high in April 2009 thru October 2013. Meanwhile Private Sector Employment has expanded by 6.2mil from the Dec 2009 low. The 6.2mil number includes the recent decline of -735,000 due to the government shutdown. If this decline is reversed, total Private Sector job gains are very likely to exceed ~7mil in the next report. The pace of job gains is better than many currently appreciate.
The pace of job gains is better than many currently appreciate.
Where do these charts lead investors?
1. The net/net of these charts indicates that as usual the Private Sector is leading us in an economic recovery.
2. Government is shrinking as an influence, but this decline masks the strength in the Private Sector. In a Free Market society we want less Government spending relative to the size of our economy.
3. Market strategists who only look at a few indicators miss the undercurrents of economic activity.
4. The Private Sector is what the stock markets represent-A stronger Private Sector justifies stronger stock markets!
5. Optimism towards equities is warranted at this time in my opinion with LgCap Domestic and International equities favored.
Via: valueplays


